Download
1 / 15
150 likes | 224 Views
Ageing of large CsI photocathodes exposed to ionizing radiation in a gaseous RICH detector A. Braem, G. De Cataldo, A. Di Mauro, A. Franco, A. Gallas Torreira, H. Hoedlmoser , P. Martinengo, E. Nappi , F. Piuz, E. Schyns Bari INFN, CERN. Attending the conference.

E N D
Ageing of large CsI photocathodes exposed to ionizing radiation in a gaseous RICH detector A. Braem, G. De Cataldo, A. Di Mauro, A. Franco, A. Gallas Torreira, H. Hoedlmoser, P. Martinengo, E. Nappi, F. Piuz, E. Schyns Bari INFN, CERN Attending the conference
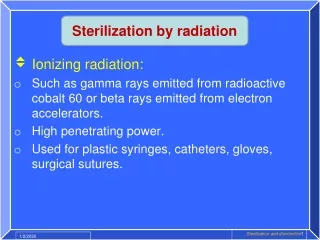
RICH DETECTOR BASED ON CsI-PHOTOCATHODE The cathode of a gaseous detector is coated with a thin layer of CsI converting photons of WL < 210nm. The single electron emitted is in turn amplified in the detector. Usually, the coated cathode is segmented into pads allowing for a 2D-localization of the Cherenkov photons. CsI-RICH systems under operation Fig. 1 Table 1 DRAWBACK OF THE MWPC OPEN GEOMETRY: THE CsI-PC IS BOMBARDED BY THE IONIC AVALANCHES
SOME HINTS ABOUT LARGE CsI-PHOTOCATHODES Chemical affinity: • CsI strongly hygroscopic, however QE (quantum efficiency) recovers from short exposure to ambient atmosphere (10-15% hygr.) (see H. Hoeldmoser’s talk at this conference) • no reaction with gases: O2,noble gases,CO2, CH4,etc (NIM A461,2001,584) Photocathode production • to achieve a reproducible QE performance over a large series (42 PCs), follow a strict procedure. Main steps are: - specific elaboration and cleaning of the PCb-pad substrate - thermal evaporation under vacuum followed by an heat treatment under vacuum - protection of the PC in a protective vessel flushed with Argon - during any transfer or storage, keep the PC under argon flow,( H2O, O2 <10ppm) PC QE PERFORMANCE KEPT STABLE OVER SEVERAL YEARS (NIM A515 2003 307) CsI-QE differential plot for several large PCs obtained from Cherenkov events analysis. Performance has been improved from 1998 production (green curve) Fig. 2
AGEINGinduced at the CsI surface, driven by physisorption mechanisms such as surface photolysis or electrolysis. Ageing is observed under: - direct exposure to high photon flux (≈10 12-14 ph/s,cm2 ,no elecrical field) (not relevant in most of RICH application)- ion sputtering from avalanches in the wire chamber under gas gainSTATUS OF AGEING STUDIES- in the 90ies, several lab studies, mixing photon irradiation and ion sputtering, and also exposure to air (NIM A364,1995,243; A387,1997,154; A454,2000,365) - HEP experiments at SPS test beams, NA44 and STAR using low level irradiation (NIM A502, 2003,76) - COMPASS: exposed to high level irradiation; some damaged spots observed (S. Dalla Torre, this conference) - HADES-GSIGOAL OF THIS WORK - study the ageing of the CsI-PC under the only ion sputtering of avalanches - using the final CsI-PCs and detector modules to be installed at the ALICE experiment - CsI-PCs never exposed to ambient atmosphereEXPERIMENTAL METHOD - irradiate several spots of the PC with Sr90-electrons - record the accumulated charge deposited by the ion avalanches - correlate this charge with the measurement of the CsI-QE at these spots and at non irradiated reference points
2 3 EXPERIMENTAL LAYOUT - RICH detector equipped with a 60x48cm2 CsI-PC anode wires running horizontal (Proto-3) - small C6F14 radiator defining a Cherenkov fiducial zone (blue) on the CsI-PC - 3 positions for locating a collimated Sr-90 source irradiating spots of 32mm Ø overlapping the fiducial Cherenkov ring 4 1 PC PC CsI CsI - - C6F14 radiator irradiation spot irradiation spot Sr90 Sr90 C6F14 Test beam Sr90 Sr90 annular annular Cherenkov Cherenkov fiducial fiducial zone zone Only 8 wires, overlapping the irradiated spots, are raised at full amplification voltage. The ageing will be effective along a stripe, 64 cm long, 35mm wide. Fig. 3 Fig. 4 Proto-3
Sr-90 source collimator MEASUREMENTS during the irradiation - Ia = anodic current of the 8 wires raised to HV (to check possible anode wire ageing) - I20pads = cathodic current of the 20 pads covered by the direct irradiation cone. (Pad size: 8.0x8.4mm2) - anode wire rate and pulse height spectra - charge at each cathode pad using the analog RO Gassiplex As seen in the fig. 6, the charge profile can be measured per pad rows (and pad columns) These elements provide the distribution of the ionic charge accumulated on the CsI-cathode (mC/cm2,s) to be correlated with the expected QE variation Along the X-coord, the charge profiles extend largely out of the direct irradiated area (blue lines), due to the multiple scattering of the electrons in the methane and the brehmstralung photons emitted from the thin mylar window Fig. 6 Fig. 5
LOCAL MEASUREMENTS OF THE CsI QUANTUM EFFICIENCY (QE) 2 methods are used: -THE VUV-SCANNER A XY-stepping system allows to scan in vacuum a CsI-PC with a VUV-beam, Ø3-5mm, D2-lamp. The photocurrent is recorded at every pad and normalized to a reference PM. A pad mapping of a quantity proportionnal to the QE integrated over the VUV-beam spectrum is shown in Fig. 7 - Cherenkov single photon counting (see layout in Fig. 3) Exposing the detector at a pion beam, Cherenkov rings that overlap the irradiated spots are recorded. Further analysis provide the differential QE plot at selected location in thr Cherenkov fiducial area. (see results in fig. 18, 19) Position 2 Position 3 Position1 Fig. 7 Fig. 8
Table 2 Dose = (I20pad x duration[s]) / (20 pads area = 13.44cm2 FOR COMPARISON WITH ALICE EXPOSURE The expected dose integrated over 10 years operation in ALICE is evaluated at 0.5 mC/cm2 Table 3
VUV-scans after irradiation at 3 positions (see table 2) anode wires Y X Fig. 9 Fig. 10 “Inefficiency” profiles taken along pad columns (Y-coord) at different X values. The sharp edges fit the stripe of the 8 anode wires under voltage making the ageing effect well restricted to the area where ions impinge the CsI-PC Fig. 11
NOVEL BUT UNDESIRED EFFECT: IT HAS BEEN OBSERVED THAT THE DEGRADATION OF THE QE INCREASES WITH THE TIME ELAPSED AFTER THE IRRADIATION IN ABSENCE OF GAS GAIN OR FURTHER IRRADIATION . THIS BEHAVIOUR HAS BEEN FOUND AT THE 3 POSITIONS OF IRRADIATION WHILE NON-IRRADIATEDSPOTS WERE CHECKED TO BE STABLE Fig. 12
EVOLUTION OF THE INEFFICIENCY WITH THE TIME ELAPSED AFTER THE IRRADIATION X-PROFILES ALONG X-COORD Y-PROFILES ALONG Y-COORD POSITION1: TIME ELAPSED after irrad: 52,142,155 DAYS (table 2 Fig. 13 POSITION 2:TIME ELAPSED after irrad: 3,118,208,220 DAYS (table 2) Fig. 14
HOW THE CsI-QE DECREASE IS CORRELATED TO THE IONIC DOSE DEPOSITED BY THE IRRADIATION ? AS SEEN IN FIG. 6,13 AND 14, BOTH, THE CHARGE AND CsI-QE DECREASE ARE MEASURED ALONG THE SAME PAD ROW . THEN, FIG. 15 SHOWS THE VARIATION OF THE CsI-QE DECREASE VS CHARGE ALONG THE X-COORD. THE DEPENDANCE IS NOT FOUND LINEAR. A LOGNORMAL FUNCTION IS ACTUALLY CHOSEN TO FIT THE DATA, SUGGESTING THAT THE LOSS OF PHOTOEMISSIVE SITES IS PROPORTIONAL TO THE SITE DENSITY Fig. 15
THE DEPENDANCE OF THE CsI-QE DECREASE VS CHARGE CAN ALSO BE OBTAINED FROM THE MEASUREMENTS MADE AT DIFFERENT DOSES AND POSITIONS (SEE FIG. 12) WHEN TAKEN AT THE SAME TIME ELAPSED AFTER IRRADIATION AS SHOWN IN FIG. 16, THE FITTING FUNCTIONS ARE NOT THE SAME AT DIFFERENT TIMES A GOOD AGREEMENT (FIG. 17) WITH THE PREVIOUS METHOD (FIG. 15) IS ONLY OBTAINED FOR THE SAME ELAPSED TIME, OF 129 DAYS IN THIS PLOT. SUCH A BEHAVIOUR MIGHT BE CORRELATED WITH THE INCREASE OF THE AGEING EFFECT WITH TIME expected dose for 10 y ALICE operation (0.50 mC/cm2) Fig. 17 Fig. 16
COMPARISON BETWEEN THE VUV-SCANS AND THE CHERENKOV PHOTON COUNTING 3 1 2 3 1 2 SIMULATION Test beam with PROTO 3 in agreement with QE decrease measure by VUV scanner The differential CsI-QE curve has to scaled down as seen in Fig. 18 to obtain a simulation close to the data (Fig. 19) 2 y (pads) 3 1 x (pads) Fig. 18 Fig. 19
COMMENTS • THESE PRELIMINARY RESULTS ARE RAISING SEVERAL QUESTION MARKS • • WHY THE CsI-QE DECREASE EVOLVE AFTER IRRADIATION ? • • IS THE RATE OF AGEING INCREASE WITH TIME CORRELATED WITH THE INITIAL DOSE ? • • IS THE AGEING DRIVEN BY THE PARTICLE RATE OR BY THE INTEGRATED CHARGE ? • • IS IT STILL AN INFLUENCE OF RESIDUAL ADSORBED WATER ?