Download
1 / 1
10 likes | 136 Views
Transcriptome comparison between human and mouse in arthritis. RA vs OA. R 2 = 0,633 R = 0,795. Marc Bonin 1 , Till Sörensen 1 , Bijana Smiljanovic 1 , Andreas Grützkau 2 , Christoforos Nikolaou 3 , Ioannis Pandis 4 , George Kollias 3 , Anthony Rowe 5 , Thomas Häupl 1

E N D
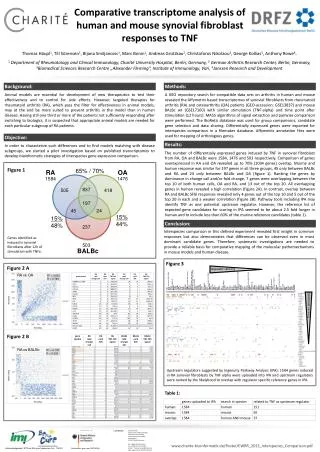
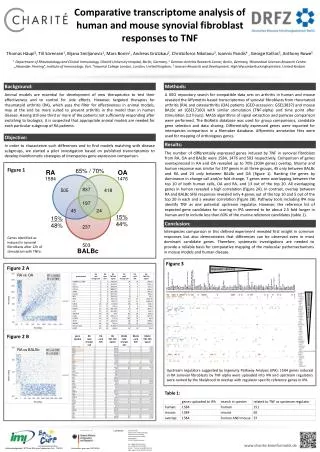
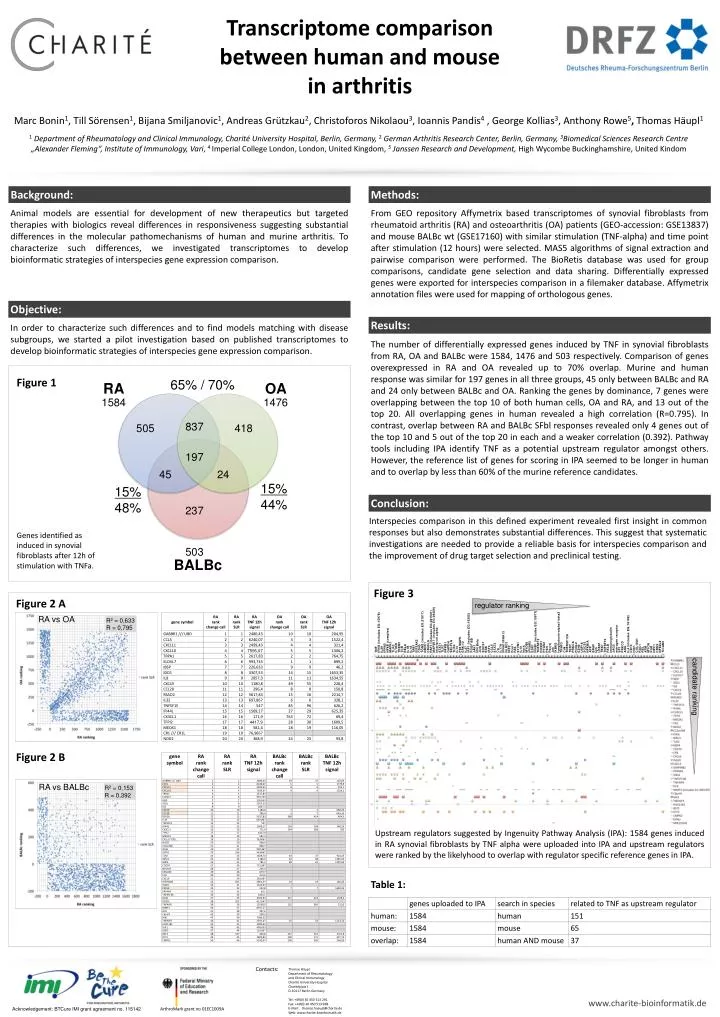
Transcriptome comparison between human and mouse in arthritis RA vs OA R2 = 0,633 R = 0,795 Marc Bonin1, Till Sörensen1, Bijana Smiljanovic1, Andreas Grützkau2, Christoforos Nikolaou3, Ioannis Pandis4 , George Kollias3, Anthony Rowe5, Thomas Häupl1 1 Department of Rheumatology and Clinical Immunology, Charité UniversityHospital, Berlin, Germany, 2German Arthritis Research Center, Berlin, Germany, 3Biomedical Sciences Research Centre „Alexander Fleming“, Institute of Immunology, Vari, 4 Imperial College London, London, United Kingdom, 5Janssen Research and Development, High Wycombe Buckinghamshire, United Kindom Background: Methods: Animal models are essential for development of new therapeutics but targeted therapies with biologics reveal differences in responsiveness suggesting substantial differences in the molecular pathomechanisms of human and murine arthritis. To characterize such differences, we investigated transcriptomes to develop bioinformatic strategies of interspecies gene expression comparison. From GEO repository Affymetrix based transcriptomes of synovial fibroblasts from rheumatoid arthritis (RA) and osteoarthritis (OA) patients (GEO-accession: GSE13837) and mouse BALBc wt (GSE17160) with similar stimulation (TNF-alpha) and time point after stimulation (12 hours) were selected. MAS5 algorithms of signal extraction and pairwise comparison were performed. The BioRetis database was used for group comparisons, candidate gene selection and data sharing. Differentially expressed genes were exported for interspecies comparison in a filemaker database. Affymetrix annotation files were used for mapping of orthologous genes. Objective: Results: In order to characterize such differences and to find models matching with disease subgroups, we started a pilot investigation based on published transcriptomes to develop bioinformatic strategies of interspecies gene expression comparison. The number of differentially expressed genes induced by TNF in synovial fibroblasts from RA, OA and BALBc were 1584, 1476 and 503 respectively. Comparison of genes overexpressed in RA and OA revealed up to 70% overlap. Murine and human response was similar for 197 genes in all three groups, 45 only between BALBc and RA and 24 only between BALBc and OA. Ranking the genes by dominance, 7 genes were overlapping between the top 10 of both human cells, OA and RA, and 13 out of the top 20. All overlapping genes in human revealed a high correlation (R=0.795). In contrast, overlap between RA and BALBc SFbl responses revealed only 4 genes out of the top 10 and 5 out of the top 20 in each and a weaker correlation (0.392). Pathway tools including IPA identify TNF as a potential upstream regulator amongst others. However, the reference list of genes for scoring in IPA seemed to be longer in human and to overlap by less than 60% of the murine reference candidates. Figure 1 Genes identified as induced in synovial fibroblasts after 12h of stimulation with TNFa. 65% / 70% RA OA 1584 1476 837 505 418 197 45 24 15% 44% 15% 48% Conclusion: 237 Interspecies comparison in this defined experiment revealed first insight in common responses but also demonstrates substantial differences. This suggest that systematic investigations are needed to provide a reliable basis for interspecies comparison and the improvement of drug target selection and preclinical testing. 503 BALBc Figure 3 Figure 2 A regulator ranking candidate ranking Figure 2 B RA vs BALBc R2 = 0,153 R = 0,392 Upstream regulators suggested by Ingenuity Pathway Analysis (IPA): 1584 genes induced in RA synovial fibroblasts by TNF alpha were uploaded into IPA and upstream regulators were ranked by the likelyhood to overlap with regulator specific reference genes in IPA. • Table 1: Contacts: Thomas Häupl Department of Rheumatology and Clinical Immunology Charité University Hospital Charitéplatz 1 D-10117 Berlin Germany Tel: +49(0) 30 450 513 291 Fax: +49(0) 30 450 513 968 E-Mail: thomas.haeupl@charite.de Web: www.charite-bioinformatik.de www.charite-bioinformatik.de ArthroMark grant no 01EC1009A Acknowledgement: BTCure IMI grant agreement no. 115142