Download
1 / 25
260 likes | 403 Views
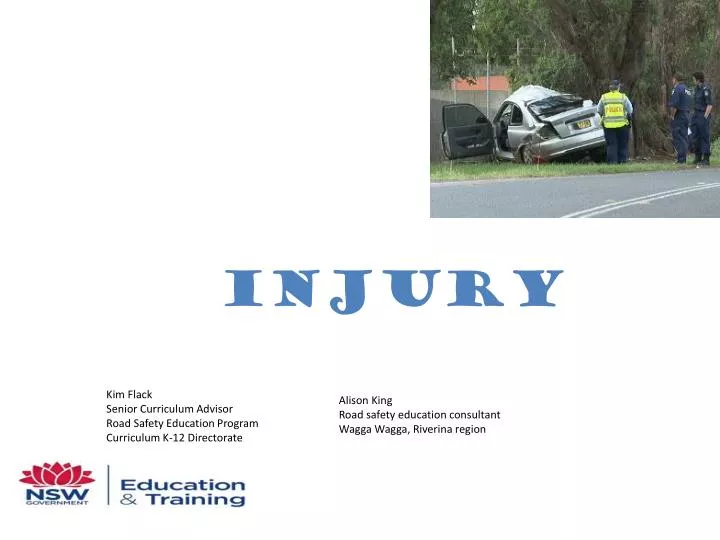
INJURY. Kim Flack Senior Curriculum Advisor Road Safety Education Program Curriculum K-12 Directorate. Alison King Road safety education consultant Wagga Wagga, Riverina region. Overview. Epidemiology – extent and prevalence Groups experiencing health inequities

E N D
INJURY Kim Flack Senior Curriculum Advisor Road Safety Education Program Curriculum K-12 Directorate Alison King Road safety education consultant Wagga Wagga, Riverina region
Overview • Epidemiology – extent and prevalence • Groups experiencing health inequities • Cost to the individuals and communities • Health care in Australia • Health promotion
Epidemiology • Injuries affect Australians of all ages. • 7.4% of all deaths registered in Australia in 2005-6 were related to Injury. • Accounts for 27 injury deaths per day
Extent - mortality & morbidity • Injuries are the most common causes of death in the 1-14 years and 15-24 years age groups as well as males aged 25-44 years. • In 2005-2006, injury accounted for 49% of all deaths of person aged 1-44 years. • Unintentional falls and transportation accounted for just over half of injury hospitalisations. • Intentionally self inflicted and inflicted by another person accounted for 12% of injury hospitalisations.
Extent – Burden of disease • Injury leaves many people with serious disability or long term conditions • In 2010, it is projected that injuries will: • account for 6.5% of the proportion of burden • be the 3rd ranked major cause of “Years of life lost due to death” For these reasons, injury prevention and control was declared a National Health Priority Issue
Spotlight on Road transport The 2008 final road toll was 374 fatalities, lowest annual total since 1944. However the provisional total for 2009 was 460 killed, up by 86 (23%) on 2008. (RTA 2010).
Road travel 1944 vs 2010 1944 - Petrol rationing, WWII continues – no new private vehicles. Vehicles had cross ply tyres, no seat belts, no crumple zones, no freeways. Only 1 in 5 people had a driver’s licence. The family car had a top speed of 130 km/h 2009 – Holden Commodore – seat belts, air bags (driver, passenger, side & curtain) ABS, ESP, TCS, crumple zones, extensive sections of major highways with dual carriageways. 2 out of 3 people have a drivers license. The family car has a top speed of 210+ km/h
Trends for casualties • All age groups have shown improvements over the last ten years • Reductions amongst 15-19 year olds have been more modest but more recently
Indigenous Australians • Injury is 3rd leading cause of death • Main cause of hospitalisation, with a rate of twice that of other Australians. • Incidence of self harm is more common. • Rates of injury in Indigenous Australians continue to rise in younger adulthood peaking in the 35-39 year age group. • In the road environment, there were three times more fatalities and 1.4 times more hospitalisations among Indigenous people compared to non-Indigenous people.
Indigenous Australians • Injury accounts for in excess of $20 million per year in acute costs.
Rural and remote - health status by remoteness Table 5.6: Selected health status indicators, by remoteness area, 2007–08 * Statistically significant (see Glossary) difference from Major cities.
Rural and remote – road statistics • Since 1990 there has been a downward trend, the majority of fatalities occurring on country roads but the 2009 there was an increase largely on rural country roads.
Older People • Falls account for about 1/3 of all hospitalised injury cases. • The rate of falls increases with age. • Rates of hospitalisation due to falls is higher for older females than males. • Deaths following falls also rise rapidly with age, especially after 70 years of age.
Falls • Heavy burden on the health system. • Have a considerable impact of quality of life, often reducing independence and speeding up admission to residential care. • Significantly contributes to premature mortality. • Direct cost of falls for Australians over 65 years was estimated to be $600 million. • Total hospital cost to the community is likely to be higher.
Older people on our roads • Older people are over represented in pedestrian fatalities and have a greater chance of being killed when they are involved in a car crash. • Dementia and vision problems are the most significant issue affecting older drivers
Gender What generalisations can you make? How can this be explained?
Road trauma considerations Source: NSW Centre for Road Safety, RTA
Younger people • Death rates among children and young people halved in the two decades to 2007, largely due to fewer deaths from transport accidents. • Land transport accidents and intentional self-harm accounted for 2 in every 5 deaths (42%) among young Australians (aged 15–24 years) in 2007. • Transport accidents, falls and assaults were the most common reasons for injury hospitalisations of young people.
Younger people Source: NSW Centre for Road Safety, RTA
Young drivers – Risk factors Source: NSW Centre for Road Safety, RTA