Download
1 / 1
30 likes | 174 Views
Fig. 1. IL-1R1 WT. IL-1R1 KO. Trap Vehicle. 35 mg/kg mIL-1 Trap. B. A. 5. 5. 4. 4. Neutrophils (X10 6 )/mouse. Neutrophils (X10 6 )/mouse. 3. 3. 2. 2.

E N D
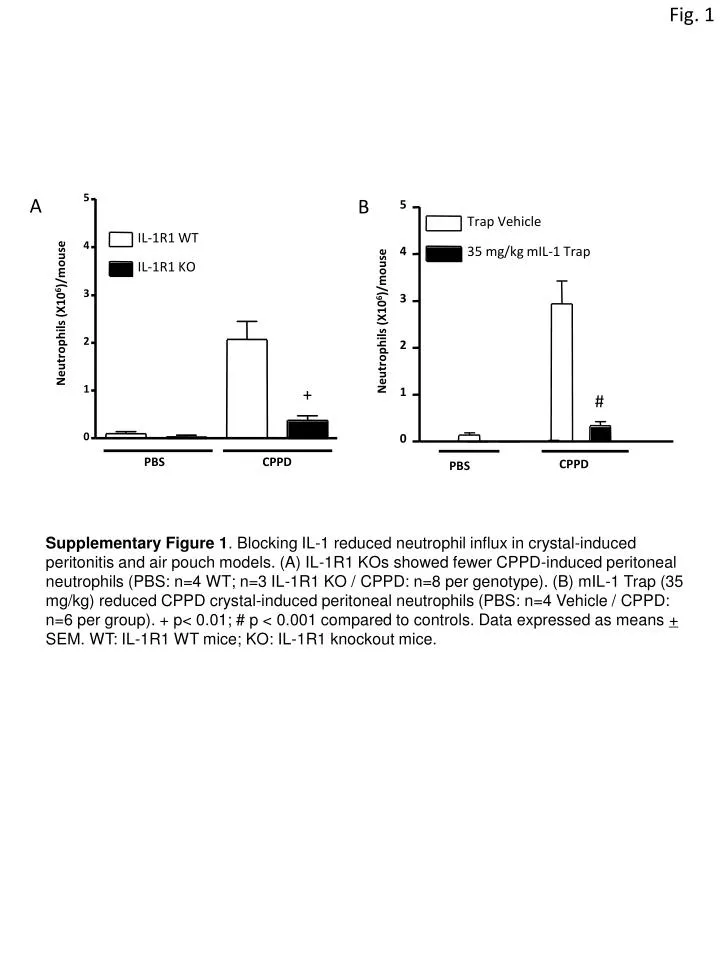
Fig. 1 IL-1R1 WT IL-1R1 KO Trap Vehicle 35 mg/kg mIL-1 Trap B A 5 5 4 4 Neutrophils (X106)/mouse Neutrophils (X106)/mouse 3 3 2 2 Supplementary Figure 1. Blocking IL-1 reduced neutrophil influx in crystal-induced peritonitis and air pouch models. (A) IL-1R1 KOs showed fewer CPPD-induced peritoneal neutrophils (PBS: n=4 WT; n=3 IL-1R1 KO / CPPD: n=8 per genotype). (B) mIL-1 Trap (35 mg/kg) reduced CPPD crystal-induced peritoneal neutrophils (PBS: n=4 Vehicle / CPPD: n=6 per group). + p< 0.01; # p < 0.001 compared to controls. Data expressed as means + SEM. WT: IL-1R1 WT mice; KO: IL-1R1 knockout mice. 1 # + 1 0 0 CPPD PBS PBS CPPD