Download
1 / 53
530 likes | 682 Views
Nutrient Trends in the Des Moines River. Donna S. Lutz Des Moines River Water Quality Network. What is the Des Moines River Water Quality Network?. Initiated in July 1967 as preimpoundment study for Saylorville Reservoir, expanded to Red Rock Reservoir in 1971

E N D
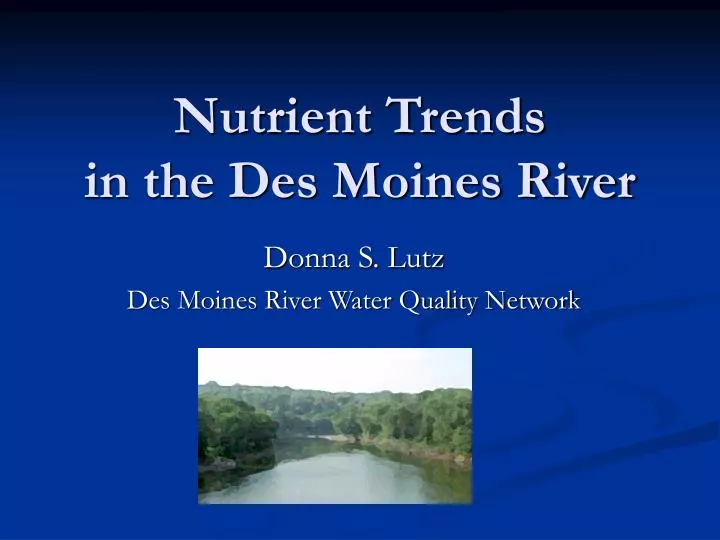
Nutrient Trendsin the Des Moines River Donna S. Lutz Des Moines River Water Quality Network
What is the Des Moines River Water Quality Network? • Initiated in July 1967 as preimpoundment study for Saylorville Reservoir, expanded to Red Rock Reservoir in 1971 • Long-term record, 36 years at many sites, total of 182 parameters, nearly 445,000 individual data records • Currently 7 regular sampling sites, monitored 22 times per year for up to 50 parameters • Data available through annual reports, paradox database, webpage (soon to be on Iowa STORET)
Des Moines River Basin • Length 350 mi • Width 50 mi • Basin 12,884 sq mi • about ¼ size of Iowa • Saylorville Reservoir • 24 mi valley/54 mi flood • 5,520 acres/ 16,100 flood • 1,100 ac-ft/yr sedimentation • Red Rock Reservoir • 18 mi valley/33 mi flood • 15,250 acres/ 1,625,00 fl • 4,470 ac-ft/yr sedimentation
Raccoon River Sub-basin North Raccoon/Middle Raccoon/South Raccoon Basin 3,411 sq mi
Routine Parameters • Physical • temperature, flow/elevation • turbidity, secchi disc depth, gas saturation • Chemical • dissolved oxygen, BOD, TOC, nutrients, suspended solids • metals, pesticides • Biological • chlorophyll pigments • bacteria
Important Programs • Short term • bacteria at beaches • safe to swim? • pesticides in fish • safe to eat? • total gas saturation • safe for fish? • overall monitoring • why? what’s up? • Long term • historical record • what is normal? • trend analysis • any improvement? • suspended solids • nutrient • ammonia, nitrate, phosphate • pesticides • chlorophyll pigments
Significant Findings • Non-point sources are the main contaminants; • soil erosion and siltation primary resource problem • Ave. loading to Red Rock 5,400 metric tons/day • Point source loading has decreased • Improved wastewater treatment has significantly reduced ammonia loading • Nitrate levels increased until 1982, no current trend • Total Phosphate levels have decreased slightly, but only by about 0.01 mg/year
Significant Findings (cont’d) • Overall, water quality has significantly improved at most sites, according to water quality index values • Pesticide levels in fish are low, but may still be of concern • Gas supersaturation-induced gas bubble traumacauses periodic fish kills below Red Rock Dam
Nutrient Trends • Total Nitrogen • Nitrogen Forms • Nitrate • Ammonia • Nutrient criteria – total nitrogen (rivers) • Total Phosphorus • Orthophosphate • Nutrient criteria – total phosphorus (rivers) • Phosphorus in sediment
Importance of River Flow • Low Flow • Nutrients can decrease due to algal utilization • However, nutrients may increase if there are point sources due to lack of dilution • High Flow • Nutrients, especially nitrate and total phosphate may increase with storm events • Antecedent precipitation important
Nitrogen Forms, % Above Saylorville Reservoir (St. 1) Below Saylorville Reservoir (St.5)
Nitrogen Forms, Concentration Above Saylorville Reservoir (St. 1) Below Saylorville Reservoir (St.5)
Nitrite +Nitrate N • Ammonia oxidized to nitrate(bacterially mediated) • Nitrite, intermediate product, (1967-76, max 0.68 mg/l, 99% of samples <0.20 mg/l) • Sources • Fertilizers, oxidation or organic N, fixation of N2, precipitation, sewage effluents • Losses • Leaching, assimilation living organisms, conversion to other forms • Soluble, easily leaches from soil
Seasonality of Nitrate Concentrations Raccoon River, monthly means unadjusted Winter Spring Summer Fall
Seasonality of Nitrate Concentrations Raccoon River, monthly means flow adjusted Winter Spring Summer Fall
Seasonal Kendall Tau Trend Analysis, Significant Trends (95%) (from Monthly Mean Data, flow-adjusted) NO2+NO3 N
Nutrient CriteriaT N in rivers 2.62 mg/l Data from 5/2000-03
Transport of Nutrients and Effects of Reservoirs
Stream Flow Separation and Nitrate Nitrogen (Schilling and Lutz) • Hydrograph separation using USGS program HYSEP (Sloto and Crouse, 1996) • Regression analyses determined if annual Q vs P relationship changed over time • Regression analyses of annual P, Q, Qb, Qs, and Q% over time • Nitrate data summarized into monthly means • Regression and correlation of monthly mean nitrate to streamflow components
Streamflow Changes, cont. • Annual precipitation also increased during 1916-2000 period • Regression residuals indicate change in rainfall-runoff relationship since 1916 (p<0.05) • Thus, more precipitation is being routed into streamflow as baseflow in latter portion of 20th century
Regression Models Relating Baseflow to Nitrate Qb provided best r2 value (0.61) compared to Q (0.59), Qs (0.48) or Q% (0.27)
HistoricalPerspective • What role might changing streamflow hydrology in the Raccoon River have had on nitrate concentrations?
Ammonia N • Sources • Biological degradation of organic matter • Point source - wastewater effluent • Nonpoint sources - fertilizer, feedlots • Importance • Oxidation of ammonia exerts an oxygen demand • Unionized ammonia form toxic to aquatic life
Phosphorus • Major sources • Nonpoint - fertilizers associated with sediment • Point – wastewater & food processing plant effluents • Importance • Limiting nutrient (when N:P ratio >16:1) • Can be re-suspended or released from sediments
Seasonal Kendall Tau Trend Analysis, Significant Trends (95%) (from Monthly Mean Data, flow adjusted) Total Phosphate
Nutrient CriteriaT P in rivers 0.118 mg/l Data from 1999-03