Download
1 / 35
350 likes | 522 Views
SATELLITE MONITORING OF SNOW AND ICE AT NESDIS Peter Romanov Cooperative Institute for Climate Studies, University of Maryland Center for Satellite Applications and Research, NOAA/NESDIS. OUTLINE. Applications and requirements Snow/Ice mapping techniques

E N D
SATELLITE MONITORING OF SNOW AND ICE AT NESDIS Peter Romanov Cooperative Institute for Climate Studies, University of Maryland Center for Satellite Applications and Research, NOAA/NESDIS
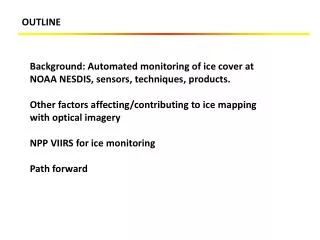
OUTLINE • Applications and requirements • Snow/Ice mapping techniques • Current activities/products/applications • Interactive snow/ice mapping • Automated systems • Plans
SNOW COVER: FACTS • Seasonal and perennial • Affects • Land surface albedo • Land-atmosphere energy exchange • Hydrological balance • Wildlife • Seasonal snow extent • NH: over 40 mln km2 (70% of the area) • SH: about 1mln km2, (mostly South America) Surface melt on the Greenland ice sheet
SNOW/ICE COVER: APPLICATIONS • NOAA • Numerical weather prediction • Climate studies (modeling, monitoring) • Hydrology • Outside NOAA • Transportation • Electric power generation • Water management • Naval Operations • Agriculture • Wildlife • Recreation • Other
SNOW/ICE: NESDIS • NESDIS major responsibilities with respect to snow and ice monitoring: • Develop techniques for monitoring of snow and ice with satellites • Provide operational satellite-derived data on snow and ice distribution for regional and global NWP models • Establish long-term snow/ice datasets for climate applications
SNOW/ICE MONITROING IN OTHER INSTITUTIONS • National Operational Hydrological Remote Sensing Center (NOHRSC) • - Snow cover, snow depth, hydrological applications, mostly over U.S. • National Climate Data Center (NCDC) • - Snow climatology, focus on surface data • Climate Prediction Center (CPC), NCEP • - Snow climatology, analysis, satellite and surface data • National Ice Center (NOAA+US NAVY) • - Operational sea ice monitoring, naval services and support
SNOW/ICE COVER: MODEL REQUIREMENTS • Regional to global scale coverage • Spatial resolution higher than model grid cell • NWP: < 10 km (ideally 1 km) • Climate: <50 km • Hydrology: ~1-2 km • Operational, daily update (ideally 2 times a day) • Parameters: • snow/ice cover, snow/ice extent • snow fraction, ice concentration • snow depth, snow water equivalent Surface observations are insufficient Satellite data should be used
SATELLITE SNOW/ICE MONITORING TECHNIQUES • Interactive • Visible imagery (polar, geo satellites) • Snow/ice extent • Automated • Microwave (polar satellites) • Snow/ice extent • Snow depth, Snow-water equivalent • Ice concentration • Visible/middle-infrared/infrared (polar and geo) • Snow/ice extent • Snow/ice fraction • Snow temperature • Combined Vis/IR and Microwave (polar and geo)
NOAA INTERACTIVE MULTISENSOR SNOW AND ICE MAPPING SYSTEM (IMS) 30+ years of mapping snow and ice over Northern Hemisphere 1972- 1998 since1999 • Paper technology • Polar orbiting satellites • Weekly • ~180 km spatial resolution • Computer-based • Polar+ geo satellites • Daily • ~25 km resolution • ~4 km resolution since 2004 On the Web: http://www.natice.noaa.gov/ims/
IMS SNOW MAP: EUROPE Fragment of IMS daily snow map over Europe Snow cover in Alps at 4 km resolution
SNOW/ICE FREQUENCY OF OCCURRENCE, 1999-2007 Jul Jan Aug Feb Sep Mar Apr Oct May Nov Jun Dec
YEARLY AVERAGE SNOW COVER AREA 30-year time series is a good material for climate change studies NOAA interactive analysis data (IMS)
MONTHLY AVERAGE SNOW EXTENT Eurasia
TRENDS IN SNOW EXTENT EURASIA Relative change is smaller in NA because of Greenland NORTH AMERICA Linear trends in the monthly snow extent 1972-2007 Largest decrease is in summer, hence strongest changes are in the Arctic region.
WHY AUTOMATED SNOW MAPPING? • Reduce human workload • Objective classification, retrievals are consistent in time • Historical data can be objectively reprocessed • Temporal and spatial resolution is limited only by instrument/satellite capabilities
SATELLITE INSTRUMENTS FOR SNOW/ICE Visible/infrared, polar orbiting NOAA AVHRR (Advanced Very High resolution Radiometer) EOS MODIS (Moderate Resolution Imaging Spectrometer) Visible/infrared, geostationary GOES-East and -West Imager Meteosat SEVIRI (Spinning VIS/IR Radiometer) Microwave, polar orbiting NOAA AMSU (Advanced Microwave Sounding Unit) DMSP SSM/I (Special Sensor Microwave Imager) Aqua AMSR-E (Advanced Microwave Sounding Radiometer)
VIS/IR: SHORT SUMMARY • Large selection of instruments and sensors - Both polar-orbiting and geostationary • High spatial resolution • Multiple daily observations help to improve snow mapping • But • Gaps in the area coverage due to clouds • Require daylight
AVHRR/NOAA DAILY SNOW/ICE MAP False color image (visible, shortwave IR, IR) High spatial resolution (up to 1 km), but limited coverage due to clouds Global coverage But needs daylight !!! Daily snow map. Snow is white, ice is yellow, clouds are gray On the Web: http://www.star.nesdis.noaa.gov/smcd/emb/snow/HTML/eurasia_snow.html
SNOW FROM GEOSTATIONARY SATELLITES • Multiple (30 min) daily observations • - Better chance to see land surface cloud-clear • - Help to distinguish snow from clouds • BUT • Coverage is limited to 66N to 66S • Spatial resolution decreases at high latitudes Example of snow map over Europe derived from Meteosat-8/SEVIRI data, 4 km resolution, snow is white, clouds are grey
SNOW COVER: AUTOMATED VS INTERACTIVE Met-8 (auto) IMS (interactive) Snow area extent
SNOW FROM GOES: SOUTH AMERICA SOUTH AMERICA BLENDED DAILY SNOW MAPS Duration of snow season On the Web: http://www.star.nesdis.noaa.gov/smcd/emb/snow/HTML/snow_sa.htm
SNOW FROM METEOSAT: SOUTH AFRICA Snow in the mountains near Cape Town, South Africa, July 11-12, 2008 22
Mar, 15 Mar, 19 Mar, 22 ADVANCE OF SNOW MELT FROM GOES Temperature of snow-covered land surface in March 2003, GOES-East data. Red: melting snow Snow free land Clouds
GOES: SNOW FRACTION • Characterizes the portion of snow in the instrument field of view • Needed to determine albedo of snow covered land surface • Derived from observations in the visible spectral band On the Web: http://www.orbit.nesdis.noaa.gov/smcd/emb/snow/HTML/fraction.htm
GOES: SNOW DEPTH • Uses relationship between snow fraction and snow depth • Estimates are made only over plain non-forested regions (Great Plains, Canadian Prairies) Light gray: clouds Dark gray: densely forested area Retrieval accuracy: ~30% Max derived snow depth: ~30 cm On the Web: http://www.star.nesdis.noaa.gov/smcd/emb/snow/HTML/dd.htm
■ SATELLITE SNOW DEPTH & STREAMFLOW Streamflow for Sheyenne river at Cooperstown, ND 47.42N, 98.02W Satellite snow depth estimates were averaged over the watershed. 2003-2004 ■ ■ 2004-2005
ICE BREAK UP ON SMALL LAKES 2004 spring season • Derived from GOES daily snow/ice maps • Large lakes and seas (Great Lakes, Hudson Bay, etc.) excluded • Ice fraction is aggregated within 10 lat x 20 lon grid cells • Ice break-up is assumed when the ice fraction becomes less than 0.8
MICROWAVE: SHORT SUMMARY • All weather application: most clouds are transparent • Multiple daily observations are available. Help to improve snow mapping • Provide some information on snow depth • But • Low spatial resolution (~30 to 50 km) • Unreliable in fall and spring (misses melting and shallow snow) • Unreliable over mountains (confuse cold rocks with snow) • Precipitating clouds prevent from snow mapping
AUTOMATED MICROWAVE SNOW/ICE PRODUCTS Microwave Surface and Precipitation Products System (MSPPS) Team, led by Dr. Ralph Ferraro Ice concentration NOAA AMSU, DMSP SSMI - 30 - 50 km spatial resolution - Global coverage - Daily products Snow cover Problems - Melting, shallow snow - Frozen ground - Precipitating clouds - Snow depth retrieval accuracy ~ 30-50% Snow water equivalent On the Web: http://www.orbit.nesdis.noaa.gov/corp/scsb/mspps/
COMBINING SNOW RETRIEVALS IN VIS/IR AND MICROWAVE Approach: Use vis/IR retrievals when cloud-clear Use reliable retrievals from microwave when cloudy or dark Output: Continuous (with no gaps) snow map on a daily basis Microwave AMSR-E Aqua MODIS Aqua Vis/IR Combined snow map
NESDIS MULTISENSOR SNOW/ICE MAPPING SYSTEM • Automated algorithm • Combines observations from 8 polar orbiting and geostationary satellites • Uses both vis/IR and microwave retrievals • Generates daily maps • 4 km nominal resolution • Global • Operational since 2005 Data from the following satellite instruments are used Imager/GOES-10 and -12 (geo) SSMI/DMSP-13,14,15 (polar, microwave) SEVIRI/MSG (geo) AVHRR/NOAA-17, 18 (polar, vis/IR) On the Web: http://www.orbit.nesdis.noaa.gov/smcd/emb/snow/HTML/multisensor_global_snow_ice.html
VALIDATION AGAINST SURFACE OBS Satellite snow cover retrievals exactly correspond to surface observations in 92 to 95% of comparisons Performed daily Up to 2700 snow reports used Most stations are in midlatitudes
COMPARISON OF AUTO AND INTERACTIVE SNOW MAPS • Pixel by pixel comparison with interactive snow charts: • Northern Hemisphere above 25 N, daily data
Auto snow IMS COMPARISON OF SNOW EXTENT • Autosnow vs IMS: snow extent Eurasia snow extent Mean absolute difference in estimates of NH snow extent Daily: ~4% Monthly: ~1.5% Mean bias: ~ -1%
PLANS • 1 km resolution globally with METOP, MSG SEVIRI • Reprocess historical data (AVHRR + SSMI,SMMR) since 1981 • - Refine, improve NH snow cover climatology • - Establish SH snow cover climatology