Download
1 / 30
310 likes | 554 Views
Explorations in Economics. Alan B. Krueger & David A. Anderson. Story of Corn. What does corn do?. Playstation example. Firms began to grow corn and stopped growing other goods

E N D
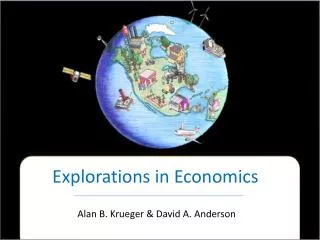
Explorations in Economics Alan B. Krueger & David A. Anderson
Story of Corn What does corn do? Playstation example Firms began to grow corn and stopped growing other goods Playstation 3 vs. Older Playstation: 249 vs. 600? What caused the lower pricing? Technology, competition among sellers, and cost of inputs. • Popcorn • Feeds animals • Produce ethanol • Every state produces it but Alaska and Hawaii. • From 2005 to 2008, price goes from 2$ to 6$. What happened?
The Draw of High Coffee Prices Starbucks rise in price has made what happen? McDonalds Dunkin Donuts Caribou Coffee Chapter 5-Mods 13, 14 & 15
MODULE 13:Understanding Supply KEY IDEA: Producers respond to price changes, offering more goods for sale when prices increase and fewer goods when prices decrease. OBJECTIVES: • To explain the concept of supply and the law of supply. • To explain the relationship between a supply schedule and a supply curve. • To identify the factors that cause the quantity supplied to be more or less responsive to price changes.
THE QUANTITY SUPPLIED Profit is the total revenue a firm receives from selling its product minus the total cost of producing it. The quantity supplied is the amount of a good that firms are willing to supply at a particular price over a given period of time.
THE LAW OF SUPPLY According to the law of supply, an increase in the price of a good leads to an increase in the quantitysupplied. (example- Tutoring in the community)
What do the Law of Demand and Law of Supply mean • Law of demand- P up, qd down; P down, qd up • Law of supply- P up, qs up; p down, qs down • What do you notice about the two laws? They are opposite and move in different directions. Demand is an inverse relationship between P and QD. Supply is a direct relationship between P and QS. • Why do you think that is? • Suppliers are worried about making money and consumers are worried about saving money. Chapter 5-Mods 13, 14 & 15
THE SUPPLY SCHEDULE AND THE SUPPLY CURVE The supply schedule for a good is a table listing the quantity of the good that will be supplied at specified prices.
THE SUPPLY SCHEDULE AND THE SUPPLY CURVE A firm’s supply curve is a graphical representation of the supply schedule, showing the quantity the firm will supply at each price.
THE MARKETS WITH SUPPLY CURVES There is perfect competition in a market when there are many firms selling identical goods, firms are free to enter and exit the market, and consumers have full information about the price and availability of goods.
THE MARKETS WITH SUPPLY CURVES There is perfect competition among firms when: • 1. Every unit of the good sold in the market is identical, regardless of which firm is selling it. • 2. The good is produced by many firms, none of which is large enough to influence the price of the good. • 3. New firms that want to supply the good are free to enter the market, and existing firms that want to stop supplying it are free to exit the market. • 4. Consumers are aware of the price charged by the various firms and have the opportunity to buy from whichever firm they choose.
ELASTICITY OF SUPPLY The elasticity of supply is a measure of the responsiveness of the quantity supplied to price changes, calculated by dividing the percentage change in the quantity supplied by the percentage change in price.
MODULE 13 REVIEW What is… A. Profit? B. Quantity supplied? C. Unit- elastic supply? D. Elastic supply? E. Supply schedule? F. Supply curve? G. Market supply curve? H. Elasticity of supply? I. Law of supply? J. Inelastic supply? K. Perfect competition?
MODULE 14:SHIFTS OF THE SUPPLY CURVE KEY IDEA: The supply curve can shift because of changes in the cost of inputs, government policies, the number of firms, technology, weather, and expectations about future prices. OBJECTIVES: • To differentiate between a movement along the supply curve and a shift of the supply curve. • To explain how changes in factors other than price cause the supply curve to shift. • To recognize which types of changes cause the supply curve to shift to the left or to the right.
WHEN OTHER FACTORS CHANGE A shift of the supply curve is the result of a change in the quantity supplied at every price, not to be confused with a movement along the supply curve, which is the result of a change in the price.
FACTORS THAT SHIFT THE SUPPLY CURVE The cost of inputs Government policies Taxes Regulations Subsidies The number of firms Technological change Natural disasters and weather Expectations about future prices
FACTORS THAT SHIFT THE SUPPLY CURVE The cost of inputs Government policies Taxes Regulations Subsidies The number of firms Technological change Natural disasters and weather Expectations about future prices
MODULE 14 REVIEW What is… A. Change in supply? B. Technological progress? C. Change in the quantity supplied? D. Inventory? E. Subsidy?
MODULE 15:PRODUCTION, COST & THE PROFIT- MAXIMIZING OUTPUT LEVEL KEY IDEA: Firms can maximize their profit by producing the quantity that equates marginal revenue and marginal cost. OBJECTIVES: • To explain the components of total cost. • To identify the condition for profit maximization. • To explain how a profit-maximizing entrepreneur decides whether to open a new firm and whether to shut down an existing firm.
UNDERSTANDING PRODUCTION The short run is the period of time during which the quantity of at least one input is fixed. The long run is the period of time in which the quantities of all inputs are variable.
UNDERSTANDING PRODUCTION A production schedule indicates the inputs needed to produce different quantities of output.
UNDERSTANDING PRODUCTION The marginal product of labor is the amount by which total output increases when one more worker is hired. Diminishing marginalproductivity describes the decrease in the marginal product of a variable input, such as labor, as more and more of it is combined with a fixed input, such as equipment.
THE COST OF PRODUCTION Fixed cost is the cost of inputs that do not vary with the amount of output produced. Variable cost is the cost of inputs that do vary with the amount of output produced.
THE COST OF PRODUCTION Marginal cost is the additional cost of producing one more unit of output.Marginal cost is calculated as the change in total cost divided by the change in output.
PROFIT MAXIMIZATION AND MARGINAL ANALYSIS The profit maximizing outputlevel is the amount of output that gives a firm as much profit as possible. Marginal revenue is the additional revenue a firm receives from selling another unit of output.
PROFIT MAXIMIZATION AND MARGINAL ANALYSIS Firms will produce where MR=MC. That is the profit maximizing output.
MODULE 15 REVIEW What is… A. Short run? B. Marginal product of labor? C. Long run? D. Marginal revenue? E. Law of diminishing returns? F. Fixed cost? G. Variable cost? H. Profit- maximizing output level? I. Total cost? J. Output? K. Diminishing marginal Productivity? L. Cost minimization?