Download
1 / 26
260 likes | 405 Views
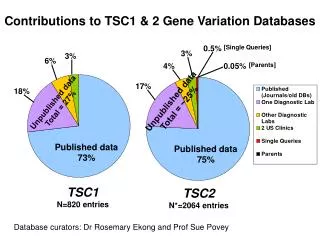
NSTX Confinement and Transport - Contributions to Databases -. S.M. Kaye PPPL, Princeton University Princeton, N.J. 08543, USA CD & Modeling ITPA St. Petersburg, Russia 8-12 April 2003. Outline – NSTX Contributions to ITPA Databases. L-H threshold data – already contributed 0D confinement

E N D
NSTX Confinement and Transport- Contributions to Databases - S.M. Kaye PPPL, Princeton University Princeton, N.J. 08543, USA CD & Modeling ITPA St. Petersburg, Russia 8-12 April 2003
Outline – NSTX Contributions to ITPADatabases • L-H threshold data – already contributed • 0D confinement • L and H-mode data • Global tE available • EFIT (magnetics only or electron p(r) + diamagnetic flux) • Working on thermal tE’s • Beam ion loss can be significant (up to 40%) • Profile data • Database of TRANSP results being assembled (NBI) • Checking consistency between magnetics and kinetics Special thanks to R. Bell, C. Bush, B. LeBlanc, R. Maingi, S. Sabbagh
H-mode Operation is Routine- “Steady-State” Achieved Ip = 0.8 MA BT = 0.5 T PNBI = 6 MW ENBI= 80-100 keV bT= 18% W = 0.25 MJ Density profile broadens during H-mode • bT up to 35% and bp up to 1.4 (highest bN are H-modes) • H-mode phase duration > 500 ms (with NBI) • L-modes more transient
8 0.6 BT (T) PNBI (MW) 4 0.3 0.0 0 0.0 0.5 1.0 1.5 0 1 2 3 4 Ip (MA) ne (1019/m3) The NSTX H-mode Access Space is Wide • Lower Single Null (LSN) & Double Null (DN) Divertor configurations • Lowest threshold/most reproducible with HFS midplane gas injection C. Bush, R. Maingi
Confinement Gain in Steady-state After the H-mode Transition is Often Modest #107759 Ip [MA] 1 PNBI /5 [MW] 0 20 bt [%] 10 0 tE [sec] L-H 0.1 Da[a.u.] 0.0 0.0 0.1 0.2 0.3 0.4 0.5 Time (s)
10 1.4 1.2 8 1 6 0.8 0.6 4 0.4 2 0.2 0 0 20 40 60 80 100 120 140 160 20 40 60 80 100 120 140 160 ne and Te Profiles Evolve Differently During Long H-mode 13 -3 0.460 sec 0.710 sec n [10 cm ] T [keV] e e 0.710 sec 0.460 sec 0.260 sec 0.260 sec 0.227 sec #108728 0.227 sec Radius (cm) Radius [cm] • ne profile hollow after transition and fills in 300-500 ms • Te profile flattens initially and peaks later in time B. LeBlanc
ELM Behavior Depends on Operating Conditions 2 LSN Da (arb.) Higher Fueling 1 0 1 LSN Lower Fueling DW/W0: 5-25% Da (arb.) 0 1 DN DW/W0: 1-4% Da (arb.) 0 0.2 0.4 0.0 0.6 Time (s) S. Sabbagh, D. Gates C. Bush, R. Maingi
6 00 kA L-H Threshold Probed 1 107659 900 kA Ip (MA) 107669 0 2 PNBI (MW) PNBI = 660 kW 0 2 PNBI (MW) PNBI = 320 kW 0 Short H-mode phase 1 Da (arb.) 0 0 0.2 0.4 0.6 Time (s)
Fast Ion Losses May Influence L-H Threshold Possible Ip dependence of Pthresh 40% Fast Ion Losses 5% DEradial? Pth,1~ ne0.61 BT0.78 a0.89 R0.94 (Snipes et al., IAEA 2002)
Bursty Fast Ion Loss May Induce Transition Da fluctuations prior to L-H transitionassociated with bounce-precession fishbone bursts L-H when significant fast ion loss (neutron drop) – Eradial? Sawtooth-free
0D Confinement Enhanced Relative to Conventional R/a Scalings •tEexp from EFIT magnetics reconstruction - Includes fast ion component • Quasi-steady conditions (i.e., 1 to 2 tE’s) • H98pby,2 up to 1.5 (wrt global tEexp)
L-Mode Plasmas Have Parameter Dependences Similar to Those at Conventional R/a • Slightly stronger power degradation tEmag ~ Ip0.76 BT0.26 PL-0.76 tE89P ~ Ip0.85 BT0.20 PL-0.50 tE97L ~ Ip0.74 BT0.20 PL-0.57
H-mode Scaling Needs More Development - ELM Dependence, Non-Linearities Dedicated scaling experiments planned
Time Dependent Kinetic Profile Measurements Allow Profile Analysis • Thomson scattering • Te(R,t),ne(R,t) • 60 Hz, 20 channels • Impurity charge exchange recombination spectroscopy • Ti(R,t),vf(R,t) • 17 channels, Dt = 20 msec • Bolometer • Prad(R,t), 16 channels • Ultra soft x-ray arrays • 4 fans of 16 channels each
Kinetic Data Validated Where Possible Te(0): XCS vs MPTS ne (0): FIR vs MPTS Ti(0): XCS vs CHERS R. Bell, M. Bitter, B. LeBlanc, K.C. Lee
Ti>Te during NBI Indicates Good Ion Confinement • Classical fast particle slowing down predicts predominant electron heating • 2/3 to electrons • 1/3 to ions • Ti = Te in edge region • High rotation associated with good ion confinement MA≈ 0.26 R.E. Bell
Global Parameters from Kinetic Analysis Agree With Those From Magnetic Analysis and Neutrons Stored Energy Neutron Rate MHD Activity TRANSP assumes classical beam slowing down S. Sabbagh, S. Kaye A.L. Roquemore
Relatively Good Agreement Between Magnetics and Kinetics EFIT01/TRANSP = 1.09 0.08 EFIT02/TRANSP = 1.15 0.13 S. Sabbagh, S. Kaye
Low Ion Thermal Transport, High Electron Thermal Transport ciciNC <ce , ciNC from NCLASS Momentum Diffusivity
Electron Losses Dominant r/a=0.4
100 ce (m2/s) Te (keV), t=0.3 s 1.5 ne = 2 1013 10 1.0 0.5 ne= 4 1013 1 5 q(r) (EFIT) 1.0 0.5 0.0 3 r/a 1 0.2 0.4 0.6 0.8 r/a Electron transport reduced when s < 0? 1 MA/4.5 kG/1.7 MW NBI ‘L-mode’ Shear reversal inferred from USXR, TRANSP D. Stutman, S. Kaye, S. Sabbagh
Electron ITB Formation with HHFW in Low Density Deuterium Plasma B. LeBlanc
Increase in Te Corresponds to Decrease in ce • Power deposition from ray tracing • Tio(t) obtained from X-ray crystal spectrometer • ce progressively decreases in the central region B. LeBlanc, R. Bell, M. Bitter
Plans • Dedicated L-H threshold study data submitted • Lower limit of PLOSS • Additional data when new experiments performed • Explore possible R/a, Ip dependence • 0D confinement data is being worked on • Global tE’s available now • Fast ion energy content/loss can be significant • Corrections for fast ion content, loss require either • TRANSP run for each discharge submitted, or • Series of TRANSP “test” runs to develop parametric scalings (assuming scalings with Ip, BT, ne, shape, etc, independent)
Plans (cont’d) • Profile data • Data validation a continuing effort • Expect further modifications to profiles, especially in outer regions • Check magnetics vs kinetics consistency • IDL scripts to extract data and create appropriate _0D, _1D, and _2D files written and submitted to C. Roach • Programmatic issue – NSTX physicists would like to analyze/publish data before releasing