Download
1 / 38
380 likes | 530 Views
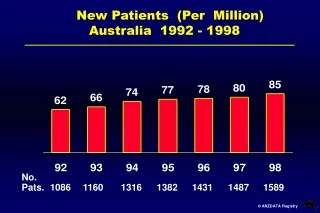
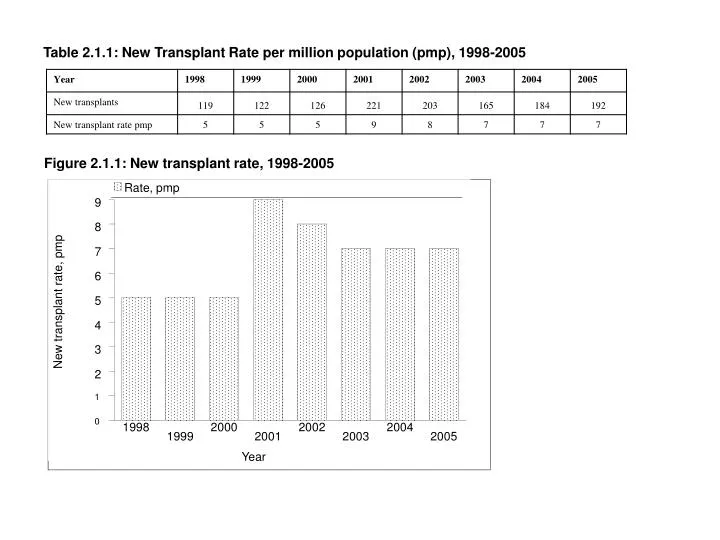
Table 2.1.1: New Transplant Rate per million population (pmp), 1998-2005. Figure 2.1.1: New transplant rate, 1998-2005. Rate, pmp. 9. 8. 7. 6. 5. New transplant rate, pmp. 4. 3. 2. 1. 0. 1998. 2000. 2002. 2004. 1999. 2001. 2003. 2005. Year.

E N D
Table 2.1.1: New Transplant Rate per million population (pmp), 1998-2005 Figure 2.1.1: New transplant rate, 1998-2005 Rate, pmp 9 8 7 6 5 New transplant rate, pmp 4 3 2 1 0 1998 2000 2002 2004 1999 2001 2003 2005 Year
Table 2.2.2: Ethnic distribution, 1998-2005 *Others: Non Malaysian
Malay Chinese Indian Bumiputra Sabah Bumiputra Sarawak Others 45 40 35 30 25 Percent 20 15 10 5 0 1998 2000 2002 2004 1999 2001 2003 2005 Ethnic group Figure 2.2.1: Ethnic distribution, 1998-2005
Table 2.2.3: Age distribution of cornea transplant recipient patients, 1998-2005 Age=date transplant-date birth; age if provided
0-9 years 10-19 years 20-39 years 40-59 years >=60 years 35 30 25 20 Percent 15 10 5 0 1998 2000 2002 2004 1999 2001 2003 2005 Year Figure 2.2.2: Age distribution of cornea transplant recipient patients, 1998-2005
Table 2.2.4: Primary diagnosis, 1998-2005 *1219 patients have 1 primary diagnosis, 104 have 2 primary diagnoses, 4 patients had 3 diagnoses, and 1 patient had 4 diagnoses
30 25 20 Percent 15 10 5 0 1998 1999 2000 2001 2002 2003 2004 2005 Year CS KC MK PBK Figure 2.2.3: Primary Diagnosis in Recipients, 1998-2005 CS = Corneal Scar KC = Keratoconus MK = Microbial keratitis PBK = Pseudophakic bullous keratopathy
Table 2.3.1.1: Number of cornea transplants with complete data set
Table 2.3.2.1: No of previous grafts in grafted eye, 2004-2005
Table 2.3.2.2: Ocular co-morbidity, 2004-2005 *Patient might have multiple ocular co-morbidity
Local USA Sri Lanka 70 60 50 40 Percent 30 20 10 0 2004 2005 Year Figure 2.3.3.1: Source of Donor Corneal Tissue, 2004-2005
.3 .25 .2 Fraction .15 .1 .05 0 5 10 15 20 25 30 35 40 45 50 55 60 65 70 75 80 Age of Donor (years) Figure 2.3.3.2: Donor age distribution, 2004-2005
Optisol MK Medium Moist Chamber 80 70 60 50 Percent 40 30 20 10 0 2004 2005 Year Table 2.3.3.3: Preservation media, 2004-2005 Figure 2.3.3.3: Preservation media, 2004-2005
Table 2.3.4.2: Type of Combined surgery, 2004-2005 *14 patients had 2 types of surgeries and 1 patient had 3 types of surgeries, combined with the corneal transplant surgery **11 patients had 2 types of surgeries combined with the corneal transplant surgery.
Table 2.3.4.4: Difference in trephined sizes of recipient and donor corneas, 2004-2005
Table 2.4.1.1: Stock and flow Table 2.4.2.1: Post transplant graft status (Optical and Non-Optical) Table 2.4.2.2: Post Transplant graft Status by Optical and Non-Optical Indication * Subjects with both optical & non-optical indications were classified into the optical group
Table 2.4.2.3: Causes of graft failure *Each patient may have more than one cause of graft failure * Data represents causes from surgeons who provided a complete data set
Table 2.4.3.1: Available data on post corneal transplant vision Table 2.4.3.2: Post transplant Unaided Vision (Optical and Non-Optical)
percent 20 18 16 14 12 Percent 10 8 6 4 2 0 6/6 6/12 6/24 6/60 4/60 2/60 CF PL 6/9 6/18 6/36 5/60 3/60 1/60 HM NPL Unaided Vision Figure 2.4.3.1: Post transplant Unaided Vision
Table 2.4.3.3: Post transplant Best Corrected Visual Acuity (Optical and Non-Optical)
percent 30 25 20 Percent 15 10 5 0 6/6 6/12 6/24 6/60 4/60 2/60 CF PL 6/9 6/18 6/36 5/60 3/60 1/60 HM NPL Best Corrected Visual Acuity Figure 2.4.3.2: Post transplant Best Corrected Visual Acuity
Table 2.4.3.4: Post transplant Unaided Vision by Optical and Non-Optical indication * Missing unaided vision excluded
percent 22 20 18 16 14 12 Percent 10 8 6 4 2 0 6/6 6/12 6/24 6/60 4/60 2/60 CF PL 6/9 6/18 6/36 5/60 3/60 1/60 HM NPL Unaided Vision Figure 2.4.3.3a: Post transplant Unaided Vision by Optical indication
percent 30 25 20 Percent 15 10 5 0 6/6 6/12 6/24 6/60 4/60 2/60 CF PL 6/9 6/18 6/36 5/60 3/60 1/60 HM NPL Unaided Vision Figure 2.4.3.3b: Post transplant Unaided Vision by Non-Optical indication
Table 2.4.3.5: Factors for Post-op Best Corrected Visual Acuity of worse than 6/12 *Patient with BCVA worse than 6/12might have more than one factor
Table 2.5.1: Stock and Flow Table 2.5.2: Post transplant complications * Each patient may have more than one complication
Table 2.5.3: Post transplant graft rejection types * Each patient may have more than one type of rejection