Download
1 / 38
390 likes | 540 Views
Indiana Industrial Energy Consumers, Inc. (INDIEC). Cost of Service. presented by Nick Phillips Brubaker & Associates, Inc. Overview. Principles / purposes Types of cost studies Major steps in a cost study Class revenue recovery Results for use in rate design. Main Principles.

E N D
Indiana Industrial Energy Consumers, Inc. (INDIEC) Cost of Service presented by Nick PhillipsBrubaker & Associates, Inc.
Overview • Principles / purposes • Types of cost studies • Major steps in a cost study • Class revenue recovery • Results for use in rate design
Main Principles • Regulation is a surrogate for competition • Limit on prices • Nondiscriminatory prices • Adequate service • Rates based on cost of service
Rates Based on Cost of Service • Stability • Conservation • Engineering efficiency • Equity
Main Purpose of aCost of Service Study To measure the responsibility of each class for the service provided by the utility.
Purposes of Cost Studies • Regulatory • Evaluation • Rate Design
Regulatory Purposes • Separate costs between differentregulatory jurisdictions • Attribute costs to customer classes based on how those customers cause costs • Calculate costs of individual typesof services • Determine how costs are to be recovered from customers and categories
$ $ $ Evaluation Purposes • Measure adequacy of current rates • Evaluate proposed changes • Unbundling of costs
Rate Design Purposes • Amount to be recovered throughretail rates • Rate design by classand rate type • Components of rates:$ / month, $ per kWh,$ per kW-month • Unbundling of rates RETAIL RATE
Fundamental Concepts • Many different types of cost • Not all customers use allparts of system • Usage patterns affectcost incurrence
Types of Cost Studies • Embedded • Marginal
Network Transmission Service Transformation Service Distribution Wires Service Customer The Generation and Delivery of Electricity Integrated Electric Utility Capacitor Switching Equipment Switching Equipment Substation Transformer Power Plant Main Power Transformer Circuit Breaker Distribution Pole ABC Power & Light Company
Three Major Steps FunctionalizationIdentify different types of cost ClassificationDetermine basis for each type of cost AllocationDistribute costs among classes and services
Functionalization Steam Nuclear Hydro Solar Wind Other Purchased Power Production Step-up Stations High Voltage Sub-Transmission Transmission Substations Distribution Poles OH & UG Lines Transformers Distribution Meters Installations Billing & Collection Service Drops Customer Information Street & Outdoor Lighting Customer Service & Facilities Management Costs, Administrative Buildings Administrative & General
Classification DemandCosts that vary with demand EnergyCosts that vary with energy provided CustomerCosts related to customers served Direct Assignment
Classification of Plant & Expenses Customer Demand Energy Production Transmission Distribution Customer Svc General
Customer Classes • Residential • General Service (Commercial) • Large Power (Industrial) • Lighting • Other
GS Res Ind Allocation Factors • Represents class share of total • Externally suppliedEnergy, customer, demand • Internally generatedDerived from prior allocations
Demand and EnergyAllocation Factors • Based on class usage at generator, not at meter • Losses: Reduction in available electricity after being transmitted over transmission and distribution (T&D) facilities
Energy Loss Factors Energy Available Expansion Factor 100.00 kWh Generation Transmission /Subtransmission 100 / 98.11 = 1.01926Trans/Sub Customer 98.11 kWh 100 / 95.88 = 1.04297Primary Customer 95.88 kWh Primary 93.34 kWh Secondary 100 / 93.34 = 1.07135Secondary Customer
Demand Allocation • Not all customers use all parts of system:Primary Distribution Plant & Expenses: Primary & SecondarySecondary Distribution Plant & Expenses: Secondary Only • Timing of demand is important (CP vs NCP)
Demand Allocation FactorProduction (MW) GS Res Ind Ltg Coincident Peak 1,304 328 402 7 Loss Factor 1.0771 1.0765 1.0461 1.0771 1 CP At Gen 1,404 353 420 7 1 CP Gen A.F. 64.26% 16.18% 19.24% 0.32%
Demand Allocation FactorPrimary Distribution (MW) Res Ind Ltg GS 420 7 353 1 CP at Gen 1,404 Portion Served At Subtrans 0 0 182 0 Prim & Below 1,404 353 238 7 1 CP Pri A.F. 70.13% 17.63% 11.89% 0.35% 1 CP Gen A.F. 64.26% 16.18% 19.24% 0.32%
Demand Allocation FactorSecondary (MW) using NCP Res Ind Ltg GS NCP Demand Secondary 1,304 526 121 23 NCP A.F. 66.1% 26.6% 6.1% 1.2%
Two Types of Demand Coincident (CP):Measurement of demandat time of system peak Non-Coincident (NCP):Maximum peakregardless of time
CP and NCP Demands Coincident Peak NCP of A NCP of B Demand CP of B B CP of A A Time
Demand Allocation Methods • Coincident peak or peak responsibility • Multiple CP – e.g. 4 CP, 12 CP • Average & Excess • Capital Substitution • Peak & Average • Energy Based
J F M A M J J A S O N D Monthly Peak Demands as a Percent of Total System Peak Summer Peaking Utility 100% 80% 60% 40%
J F M A M J J A S O N D Monthly Peak Demands as a Percent of Total System Peak Winter Peaking Utility 100% 80% 60% 40%
J F M A M J J A S O N D Monthly Peak Demands as a Percent of Total System Peak 12 Month Peaking Utility 100% 80% 60% 40%
Coincident Peak DemandAllocation Factor MW 2,500 MW Percent Res 2,000 64.26% 1,404 1,500 16.18% 353 GS 1,000 Ind 420 19.24% 500 Ltg 7 0.32% 0 2,185 J F M A M J J A S O N D 100.00% Coincident Peak
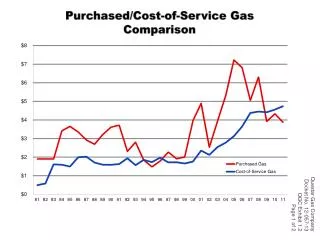
Pipeline Storage Storage Gas IndustryFunctional Structure Burner Tip Pipeline 1 Wellhead City Gate LDC Pipeline 2 Pipeline 3 PRODUCTIONPurchased Gas Cost TRANSMISSION – STORAGEPipeline Transportation Cost DISTRIBUTION - STORAGE
Cost Study Results Ind Res GS Ltg Total Rate Base $ 629.8 $ 221.5 $ 279.5 $ 19.2 $1,150.0 195.9 Revenue 293.5 111.7 7.6 608.7 175.0 Expense 256.4 96.1 6.7 534.2 $ $ Income (Return) $ 37.1 $ 15.5 20.9 $ 0.9 74.5 ROR 5.9% 7.0% 4.9% 7.5% 6.5% RROR 91 115 108 75 100 Subsidy (6.0) $ 2.0 (0.5) $ $ 4.6 $ $ - Source: Cost Study Summary - $ Millions
Cost Study Measures (1) Class Rate of Return (ROR): Income Rate Base ROR = Revenue - Expenses Return (Income) =
Cost Study Measures (2) Relative Rate of Return (RROR): ROR of class ROR of system RROR =
Cost Study Measures (3) Subsidy: Subsidy = Revenue - Cost of Service Expenses +Return @ Target ROR Cost of Service =
Cost Study Results Rate isToo Low Rate isToo High Rate is At Cost = System Average 100%Zero < System Average <100%Negative > System Average >100%Positive Rate of return Relative ROR Subsidy
Using Cost Study For ClassRevenue Increases GS Ind Res Ltg Total Rate Base $ 629.8 $ 221.5 $ 279.5 $1,150.0 $ 19.2 Fair ROR 8.90% 8.90% 8.90% 8.90% 8.90% Req’d Return 56.1 19.7 102.4 1.7 24.9 Income $ 37.1 $ 15.6 $ 20.9 $ 74.5 $ 0.9 4.1 4.0 Income Def’cy 19.0 27.9 0.8 1.644 1.644 1.644 Tax Factor 1.644 1.644 Revenue Def’cy $ 31.1 $ 6.9 $ 6.5 $ 1.3 $ 45.8 Source: Cost Study Summary - $ Millions