Download
1 / 1
10 likes | 113 Views
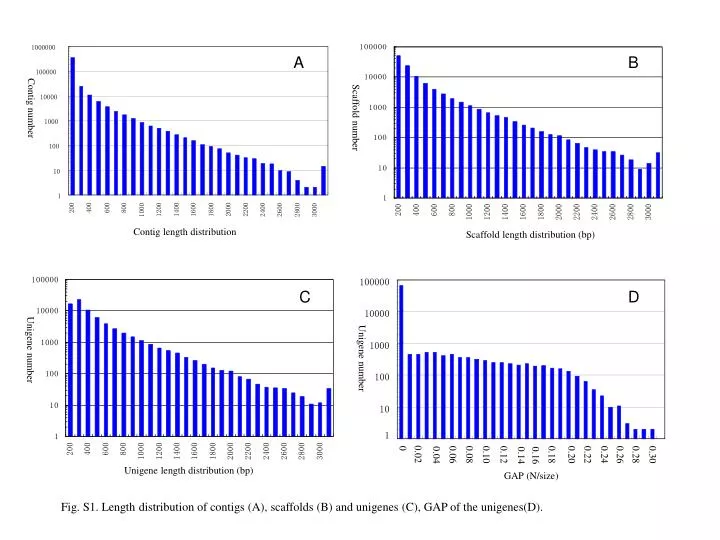
A. B. 1000000. Contig number. 100000. Scaffold number. 10000. 1000. 100. 10. 1. 200. 400. 600. 800. 2000. 1200. 1400. 1600. 1800. 2200. 2400. 1000. 2600. 2800. 3000. Contig length distribution. Scaffold length distribution (bp). 100000. C. D. 10000. Unigene number.

E N D
A B 1000000 Contig number 100000 Scaffold number 10000 1000 100 10 1 200 400 600 800 2000 1200 1400 1600 1800 2200 2400 1000 2600 2800 3000 Contig length distribution Scaffold length distribution (bp) 100000 C D 10000 Unigene number Unigene number 1000 100 10 1 0.02 0 0.06 0.08 0.10 0.12 0.18 0.20 0.22 0.24 0.26 0.28 0.30 0.04 0.14 0.16 Unigene length distribution (bp) GAP (N/size) Fig. S1. Length distribution of contigs (A), scaffolds (B) and unigenes (C), GAP of the unigenes(D).


![public class One { public static void main(String[] args) { int size = 10, nuf, fun;](https://cdn2.slideserve.com/4021595/slide1-dt.jpg)