Download
1 / 42
420 likes | 436 Views
Explore the transformative world of spatial analysis through the lens of the NCAA basketball tournament. Chapters 14 and 6 provide answers, support decision-making, and reveal patterns essential for understanding spatial data.

E N D
Spatial Analysis Handout • On course web site • Overlays (union, intersect, identity) • Buffering • Map Algebra • Clipping and Masking • Recoding • Many others! “Spatial Madness” Article!Spatial analysis of NCAA basketball tournament
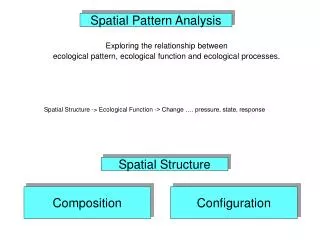
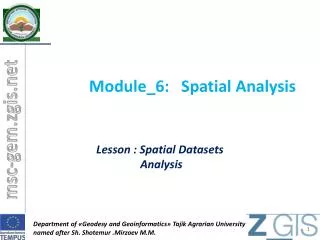
Spatial Analysis Longley et al. Chapters 14, 6
answer questions, support decisions, and reveal patterns Spatial Analysis • all of the transformations, manipulations, and methods • Data ----> Information ---> Understanding • "a set of methods whose results change when the locations of the objects being analyzed change"
calculating the average income for a group of people? calculating the center of the United States population? Which is Spatial Analysis?
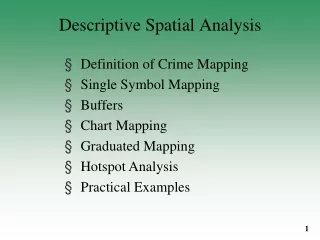
Types of Spatial Analysis • Queries and reasoning • Measurements • Aspects of geographic data, length, area, etc. • Transformations • New data, raster to vector, geometric rules • Descriptive summaries • Essence of data in 1 or 2 parameters • Optimization - ideal locations, routes • Hypothesis testing - sample to entire pop.
Residential areas in flood zoneBUTneed spatial analysis to pinpoint locations GIS Analysis Model (flowchart)
2 Analysis Examples from ArcGIS • Interpolation - soil samples on a farm [transformation] • Location Analysis - coffee shops & customers [optimization]
"a set of methods whose results change when the locations of the objects being analyzed change" • Interpolation - soil samples on a farm • Location Analysis - coffee shops & customers
Interpolate samples, then query to find pH > 7Farmer needs to treat these areas w/ammonium sulfate GIS Analysis Model
pH surface [pH surface] > 7 Instead of hillshade, use raster calculator again
Result: areas that farmer should treat w/ammonium sulfate to lower the pH to 7 so that soil is balanced
The Farm • Size = ~5.35 acres (233,046 sq ft. or 21,650 sq m) • Combined size of new treatment areas = ~0.145 acres (6,338 sq ft or 588 sq m) • Ammonium sulfate @ $50.00 per acre • Treat whole field - $267.50 • Treat only where needed - $7.25 • Crop yield and treatment maps over time
"a set of methods whose results change when the locations of the objects being analyzed change" • Interpolation - soil samples on a farm • Location Analysis - coffee shops & customers
Best location for new Beanery w/ location analysis ( distance & proxmity )
Marketing questions • Too close to existing shops? • Similar characteristics to existing locations? • Where are the competitors? • Where are the customers? • Where are the customers that are spending the most money?
Shops w/in 1 mile will compete for customersPotential shops > 1 mile away GIS Analysis Model
Result: yellow/orange = close to shopspurple/blue = farther away
Spending Density Function, Customer Spending
Result: Dark blues are greatest density of customer spending
Spending density ([Distance to Shops] > 5280) & ([Spending density] > .02) Find areas 1 mile from an existing shop that are also in a high spending density customer area
Result: Best locations for a new Beaneryw/ proximity to an interstate highway, zoning concerns, income levels, population density, age, etc.
Visualization & Spatial Analysis:An Example from The Districthttp://dusk.geo.orst.edu/gis/district.html More… Hot Spot Analysis: Part 1- http://bit.ly/9xIJBN Part 2- http://bit.ly/aRmN2m Part 3- http://bit.ly/bDs9Uj
Uncertainty in the Conception, Measurement, and Representation of Geographic Phenomena • Previous examples assumed it didn’t exist • Conception of Geographic Phenomena • Spatial Uncertainty - objects do NOT have a discrete, well-defined extent • Wetlands or soil boundary? • Oil spill? pollutants or damage? • Attributes - human interp. may differ
Uncertainty in Conception • Vagueness - criteria to define an object not clear • What constitutes a wetland? • An oak woodland means how many oaks? • Seafloor ages/habitats • What does a grade of “A” really mean??
Uncertainty in Conception Ambiguity - y used for x when x is missing Direct indicators: salinity (x) or species (y) Indirect more ambiguous Wetlands (y) of species diversity (x)?? Figure courtesy of Jay Austin, Ctr. For Coastal Physical Oceanography, Old Dominion U.
Uncertainty in Conception • Regionalization problems • What combination of characteristics defines a zone? • Weighting for composites? • Size threshold for zone? • Fuzzy vs. sharp
Uncertainty in Measurement • Physical measurement error • Mt. Everest is 8,850 +/- 5 m • Dynamic earth makes stable measurements difficult • Seismic motion • Wobbling of Earth’s axis • Wind and waves at sea!
Uncertainty in Measurement • Digitizing error, e.g., • Undershoots • Overshoots • “Gafs”
Uncertainty in Measurement • Misalignment of data digitized from different maps • Rubbersheeting is a corrective technique
Uncertainty in Measurement • Different lineages of data • Sample vs. population
Uncertainty in RepresentationRaster Data Structure Classification based on dominance, centrality? mixels
Uncertainty in RepresentationVector Data Structure Zones based on only a few points Points in corners of polys
Uncertainty in AnalysisEcological Fallacyan overall characteristic of a zone is also a characteristic of any location or individual within the zone Factory w/no Chinese employees may have closed
Modifiable Areal Unit Problem (MAUP) • number, sizes, and shapes of zones affect the results of analysis • Many ways to combine small zones into big ones • No objective criteria for choosing one over another Path of boundary changes where high pop. is
Uncertainty of Geographic Phenomena • Conception - spatial, vagueness, ambiguity, regionalization • Measurement - field, digitizing, lineage • Representation - raster, vector • Analysis - ecological fallacy, MAUP