Download
1 / 18
180 likes | 195 Views
Learn how to test hypotheses for differences between independent populations such as exam grades, salaries, and productivity. Understand the use of chi-squared test for independence.

E N D
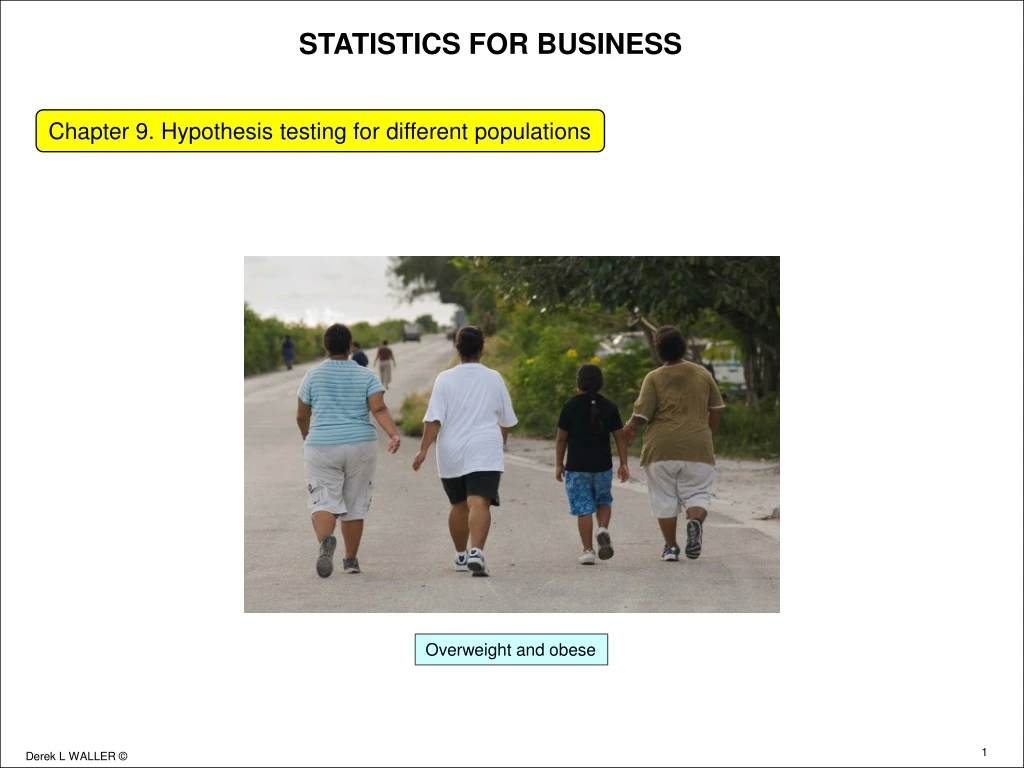
STATISTICS FOR BUSINESS Chapter 9. Hypothesis testing for different populations Overweight and obese
STATISTICS FOR BUSINESS (Hypothesis testing for different populations) Overweight and obese Differences between independent populations such as: Professor wants to know if there is a significant difference between exam grades in his morning class and his afternoon class Firm wishes to know if there is a significant difference between the salaries of its male and female employees Company is interested to know if there is a significant difference between the productivity of his employees in one country and another Retail company wishes to know if sales of a certain product in one store is significantly different from a store in a different location Hotel wishes to know if quality at one city location is significantly different from another International health organization wants to know if there is a significance differences between obesity in one country and another
STATISTICS FOR BUSINESS (Hypothesis testing for different populations) Overweight and obese Two independent populations Distribution of Population N° 2 Distribution of population N° 1 Mean = µ1 Standard deviation = s1 Mean = µ2 Standard deviation = s2 Sampling distribution from Population N° 1 Sampling distribution from Population N° 2
STATISTICS FOR BUSINESS (Hypothesis testing for different populations) Overweight and obese Distribution of all possible values between two means Standard error of difference Distribution of all possible values of Mean
STATISTICS FOR BUSINESS (Hypothesis testing for different populations) Overweight and obese Sample distribution of differences between sample means Difference is positive when: Difference is negative when: when the two population means are equal when population standard deviations are known. then when population standard deviations are unknown, then same as n1 and n2 are sample sizes are the respective variances
STATISTICS FOR BUSINESS (Hypothesis testing for different populations) Overweight and obese Why begin with variance in order to obtain standard deviation? Assume that the variance of sample N° 1 is 16.0 Thus the standard deviation of sample N° 1 is √(16.0) = 4.0 Variance of sample N° 2 is 9.0 Thus standard deviation of sample N° 2 is √(9.0) = 3.0 If we combine the samples; what is the standard deviation? It is not 4.0 + 3.0 =7.0 We must first find the sum of the variance: 16.0 + 9.0 = 25.0 And then take the square root of the sum of the variance or √(25.0) = 5.0
STATISTICS FOR BUSINESS (Hypothesis testing for different populations) Overweight and obese Test statistic for difference between two populations: Large samples Test statistic for samples of size greater than 30: Testing hypothesis for differences between two populations: Testing hypothesis for differences between two populations when standard deviation unknown : When hypothesis is that there is no difference, (µ1 - µ2)H0 = 0:
STATISTICS FOR BUSINESS (Hypothesis testing for different populations) Overweight and obese Hypothesis testing for differences between paired samples Paired samples, or those that are dependent often in a before and after situation. • Weight loss of individuals after a diet program • Productivity improvement after an employee training program • Sales increases of a certain product after an advertising campaign • Improvements in a sports event after a training program • Purpose of tests to see if positive changes have been made as a result of action • When we make this analysis we remove effect of other variables, or extraneous factors • Analysis is similar the analysis for hypothesis testing for a single population
STATISTICS FOR BUSINESS (Hypothesis testing for different populations) Overweight and obese Example: Health spa and weight loss At 5% significance level, is there evidence that weight loss of participants is greater than 10 kg? H0 ≤ 10 kg: H1 > 10 kg: H refers to difference in weights before and after program. Sample size is 13 or less than 30 so use Student-t. At 5% significance t = ± 1.7823 For sample data, x-bar of difference is 11.7692 kg Standard deviation of sample s is 4.3999 kg: Standard error is s/√(n) = 4.3999/√(13) = 1.2203 kg As 1.4498 is less than 1.7823 accept null hypothesis: No evidence that weight loss is more than 10 kg. At this significance level, marketing information is incorrect.
STATISTICS FOR BUSINESS (Hypothesis testing for different populations) Overweight and obese Chi-squared as a test of independence Purpose of chi-squared test is to see if there is a relationship of sample data and certain situations It uses the chi-squared statistic thatgives a frequency distribution fo is observed frequency of the sampling experiment feis expected frequency based on sample data • The distribution of the chi-squared is always positive (it is squared) • The value of c2extends from zero to the right on the x-axis • The y-axis is the frequency of occurrence • There is a different chi-squared distribution for each degree of freedom • The value of chi-squared is calculated from contingency tables
STATISTICS FOR BUSINESS (Hypothesis testing for different populations) Overweight and obese Chi-squared distribution for three different degrees of freedom
STATISTICS FOR BUSINESS (Hypothesis testing for different populations) Overweight and obese Consider International firm with operations in USA, Germany, Italy, and England Samples are taken of employee attitudes towards: Current 8 hour/day, 5 day week schedule and proposed 10 hour/day, 4 day week schedule Sample data give the following. These are observed frequencies, fo • This is a contingency or cross-classification table: • Columns give preference according to country • Rows give preference according to schedule • There are two rows and four columns (Totals are not included). • Thus, a 2 x 4 contingency table • Degrees of freedom are (2 – 1)*(4 - 1) = 3
STATISTICS FOR BUSINESS (Hypothesis testing for different populations) Overweight and obese Degrees of freedom – similar concept to Student-t distribution Consider the following contingency table Total are given “Yes” is where there is freedom to chose a value “No” there is no freedom to chose Degrees of freedom: (No of rows - 1)*(No of columns-1) = (3 -1)*(4-1) = 6
STATISTICS FOR BUSINESS (Hypothesis testing for different populations) Overweight and obese For the international firm: • ASSUME • pU = proportion in USA who prefer present schedule • pG = proportion in Germany who prefer present schedule • pI = proportion in Italy who prefer present schedule • pE = proportion in England who prefer present schedule Null hypothesis is these proportions are equal and any difference in preference is due to chance. Ho:pU = pG = pI = pE Alternative hypothesis is these proportions are not equal: Country of employment has bearing on the result H1:pUpGpIpE For a given significance level, is there evidence of a difference?
STATISTICS FOR BUSINESS (Hypothesis testing for different populations) Overweight and obese Development of expected frequencies fe: Observed frequencies, fo: If null hypothesis is true: Proportion who prefer 8 hour/day schedule is , 816/1,200 = 68.00% Proportion who prefer 10 hour/day schedule is 384/1,200 = 32.00% Using this develop the table for expected frequencies, fe: Expected frequencies, fe: Example: USA: 8 hour/day = 68%*320 = 217.60: Germany 10 hour/day = 32%*315 = 100.80
STATISTICS FOR BUSINESS (Hypothesis testing for different populations) Overweight and obese Calculation procedure for sample chi-squared value
STATISTICS FOR BUSINESS (Hypothesis testing for different populations) Overweight and obese At 5% significance, is there evidence that work preference is related to country? Sample chi-squared value is 6.3325 From chi-squared relationship, at a 5% significance critical c2 is 7.8147 Sample value less than critical: No evidence of relationship Alternatively: p-value of sample is 9.65%. Critical p-value is 5% Area = 9.65% Area 5.00% 6.3325 7.8147
STATISTICS FOR BUSINESS (Hypothesis testing for different populations) Overweight and obese At 10% significance, is there evidence that work preference is related to country? Sample chi-squared value is 6.3325 From chi-squared relationship, at a 10% significance critical c2 is 6.2514 Sample value greater than critical: Evidence of relationship Alternatively: p-value of sample is 9.65%. Critical p-value is 10% Area 10.00% Area = 9.65% 6.2514 6.3325