Download
1 / 12
120 likes | 139 Views
This project aims to extend existing ER diagrams with data transformation entities, implement fast algorithms for creating ER diagrams from SQL queries, and study ER diagram properties. It explores data transformations at the entity and attribute levels.

E N D
Enhancing ER Diagrams to View Data Transformations Computed with Queries
Disclaimer • Teaching Database Systems courses many years • Database processing requires understanding data structure before processing • But I have hardly worked on conceptual modeling or database modeling • Ladjel gave me guidance
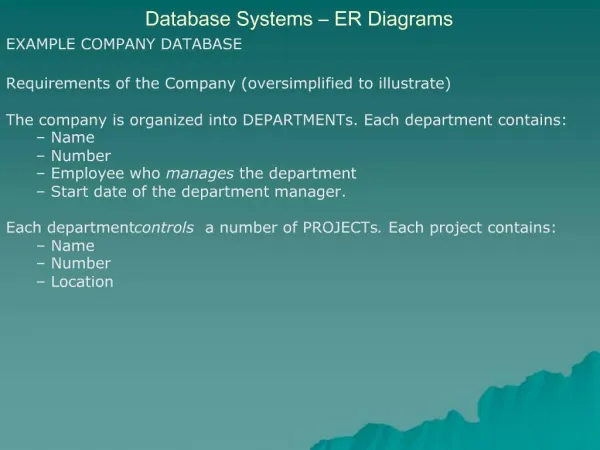
Motivation: Data Sets for Analytics • Input for Machine Learning or Statistical Models: n records, p features/variables (dimensions, categorical/discrete) • Built by many SQL queries: SPJA • Original database does have some ER diagram behind, maybe denormalized • Queries, views: disorganized, written independently • DB populated by queries instead of transactions/ETL • Data set does have entity (and relational) representation • In general, no ER diagram exists for temporary tables/views/exports
Our contributions • Extending existing ER diagram with “data transformation entities” • Minimal changes to UML diagram notation • Entity universe: source + transformation • Tranformed attribute: any expression from SPJA relational algebra • Fast algorithm to create ER diagram from queries • Preliminary study of ER diagram properties
Preliminaries • UML entity notation: scalable, Object-Oriented • n tables: all linked by 1:N and 1:1 relationships • Entity and referential integrity: satisfied Ti (K) Tj (K) K (T i ) K (T j ) • New tables derivedvonly with SPJA queries • Derived attributes with aggregations, math and string expressions, including CASE statements
Our ER diagram extensions • Logical level: minimal: • labeling entity names, • same notation for relationships • Physical level (SQL): • zoom in view with relational queries • Semantics: data analyst point of view
Data Transformations • Entity (table) level: only relational queries • join (denormalization to gather attributes, left outer joins) • aggregation/projection (to derive new attributes) • selection (filter is important) • Attribute (column) level: • denormalization (expressions, functions, CASE) • aggregation (GROUP BY, global)
Properties of our ER diagram • Logical and physical level come closer, but still separate • PKs and Fks remain the glue • Queries take the role of insert/delete/update in traditional DB • Complete (no table left out) and consistent (every piece of data derived via queries) • Transformation entities are weak entities • Provenance can be tracked; flow can be embedded in entity labels
Conclusions • Any diagram helps analysts, but there will not be an ER model in the traditional sense • A first step to have a DB ER diagram of data transformations • Complements flow diagrams • Relational, but can be later extended to non-relational data (text, semistructured) • DB state: As of now, source refreshed via transactions/ETL. Versioning: future ( temporal & stream databases)