Download
1 / 16
160 likes | 243 Views
Production Possibilities. Homework and Chores. What have you learned to complete homework and/or chores more quickly and efficiently? What has caused the U.S. to become more productive since when your parents were young?. WWII.

E N D
Homework and Chores • What have you learned to complete homework and/or chores more quickly and efficiently? • What has caused the U.S. to become more productive since when your parents were young?
WWII • During WWII, the U.S. converted the nation’s factories from producing consumer goods, such as cars and clothing, to making tanks, guns and other good necessary for the war effort.
Trade-offs • This scenario represents the classic questions that a country faces: • What goods should be produced? • What are the trade-offs between “guns” or “machinery” (capital goods) and “butter” (consumer goods) • With limited resources (land, labor, capital and entrepreneurial ability), a nation can produce limited goods and there is an opportunity cost, or trade-off. • With the production of more tanks, less cars can be produced
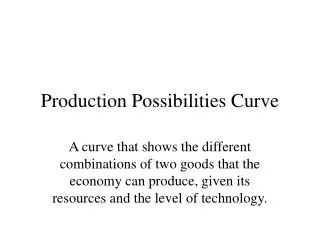
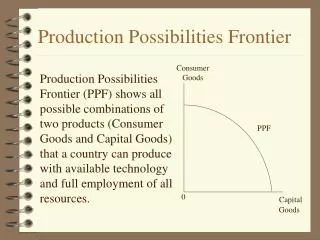
Production Possibilities Frontier • Economists, governmental officials, businesses, and individuals continually strive to increase productivity and efficiency because an economy has limited resources which can be combined in various ways to produce a variety of goods and services. • Deciding what to produce requires choices and involves opportunity costs and tradeoffs for nations, individuals, and businesses. • Economists use a simple model to describe an economy’s possible production, current production, and potential production called the Production Possibilities Frontier or Production Possibilities Curve. • The model shows the possible combinations of the 2 types of goods that can be produced when available resources are employed fully and efficiently
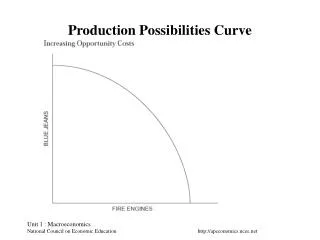
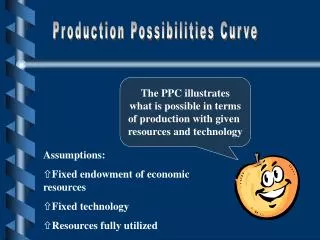
Production Possibilities Frontier • The PPF curve is a simple model showing the alternatives of goods and services which a society can produce when it’s using all of its resources fully and efficiently • The PPF curve is a boundary dividing the points on the inside (which show under-utilization or inefficient use of resources) from those beyond the line which are unattainable given the current resources and technology of the country • A shift in the boundary would reflect economic growth and an increase in available resources
Assumptions of a PPF • Production possibilities tables and curves are used to illustrate the economizing problem of scarcity. The curve and points on the line assume: • Nation/business is operating efficiently (full employment and full production). • Resources are fixed in quantity and quality. • Technology is constant during analysis. • Nation/business is producing only TWO types of products (ex/ farm products and manufactured goods). • It is possible to produce a combination of these two goods.
Resources available: Your business has 6 pieces of paper to produce either paper airplanes or paper footballs. What are your production possibilities? You can make 1 airplane or 2 footballs with each sheet of paper. Finish the chart and graph your results
Resources available: Your business has 6 pieces of paper to produce either paper airplanes or paper footballs. What are your production possibilities?
Footballs 12 10 8 6 4 2 0 0 1 2 3 4 5 6 Airplanes Deriving a PPF • Steps: • 1. Place each good on an axis • 2. Use the schedule to plot the points • 3. CONNECT THE DOTS to form a curve
Deriving a PPF Footballs • Steps: • 1. Place each good on an axis • 2. Use the schedule to plot the points • 3. CONNECT THE DOTS to form a curve 12 10 8 6 4 2 0 0 1 2 3 4 5 6 Airplanes
Footballs 0 1 2 3 4 5 6 Airplanes Deriving a PPF • Steps: • 1. Place each good on an axis • 2. Use the schedule to plot the points • 3. CONNECT THE DOTS to form a curve 12 10 8 6 4 2 0
Footballs 0 1 2 3 4 5 6 Airplanes Production Possibilities Frontier 12 10 8 6 4 2 0 • Efficiency: producing the maximum possible output from available resources • The curve (the line) represents what isattainable and efficient • The points along the line represent maximum possible combinations of the two goods without new technology or growth • Note: Optimal or best product-mix will be some point on the curve, but the exact point depends on society; this is a normative decision.
Footballs 0 1 2 3 4 5 6 Airplanes Inefficient or Unattainable • I represents inefficient use of resources, but are attainable • Points inside the curve represent underemployment or unemployment of resource available to the society at that time • U represents unattainable combinations • Points outside the curve cannot be attained, the nation/business does not have the available resources to produce at that level. 12 10 8 6 4 2 0 U I
Opportunity Cost and the PPF • Movement along line: The shape of PPF shows opportunity costs of producing more of one type of good over the other.
Straight or Bowed? • The PPF will be straight if the economy has resources that are perfectly adaptable to producing both goods • The PPF will be bowed out when resources in the economy are not all perfectly adaptable to the production of both types of goods