Download

1 / 6
110 likes | 482 Views
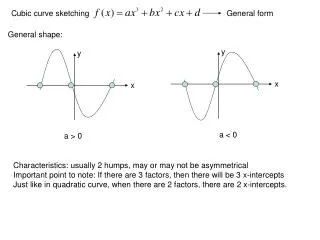
Curve Sketching. The Second Derivative and Points of Inflection. Graphs that are Concave Up on the interval a < x < b where f”(x) < 0. This means that the graph lies above the tangent line at each point on the interval. Graphs that are Concave Down on the interval a < x < b where f”(x) < 0.

E N D
The Second Derivative and Points of Inflection. Graphs that are Concave Up on the interval a < x < b where f”(x) < 0. This means that the graph lies above the tangent line at each point on the interval. Graphs that are Concave Down on the interval a < x < b where f”(x) < 0. This means that the graph lies below the tangent line at each point on the interval.
Points of Inflection A point (c, f(c)) on the graph f(x) is said to be a point of inflection if the graph has a tangent line at x = c and if f’(x) does not change sign at x = c and f”(x) does change sign at x = c. It is essential to note that f”(x) = 0 does not necessarily correspond to a point of inflection. You must also verify the signs! c f”>0 f”< 0
Two examples to illustrate this: • Consider f(x) = x4. • then f’(x) = 4x3 and f”(x) = 12x2. • It follows that f”(0) = 0, but it can be • seen that (0,0) is not an inflection • point. • Consider f(x) = . Then f”(x) = . • It follows that f”(x) does change sign, • nevertheless, x = 0 does not correspond • to an inflection point since f(0) is • undefined.
Each of the graphs below represent the second derivative f”(x) of a function f(x). • On what interval is the graph of f(x) concave up/down? • List the x-coordinates of all points of inflection. • Make a rough sketch of a possible graph of f(x) assuming that f(0) = 1. 1 1 2 CU on x< 1 CD on x > 1 P.O.I. at x = 1 CU on x<0, 0<x<1 CD on x > 1 P.O.I. on x = 1 CU on x<0,x>2 CD on 0<x<2 P.O.I. on x=0,x=2
Create a sketch based on the following information: • From A to B, y’ = 0. • From B to D, y’ >0. • At C, y” = 0. • Between C and D, there is the only y-intercept. • At D y’ = 0 and y” <0 • From D to F, y’ <0. • At E, y” = 0. • At F, y ‘ = 0 and y” >0. • At G, y’ = 0 and y” < 0 • From F to G, y’ > 0. • From G to H, y’ < 0. • H is the only x-intercept • Start your graph at A and finish at H. A H