Download
1 / 58
580 likes | 753 Views
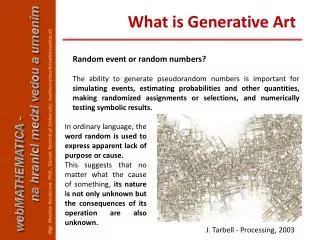
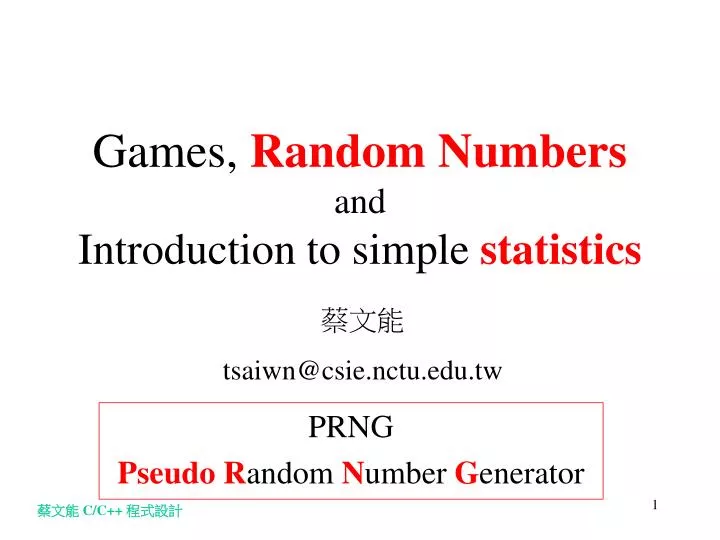
Games, Random Numbers and Introduction to simple statistics. PRNG Pseudo R andom N umber G enerator. 蔡文能 tsaiwn@csie.nctu.edu.tw. Agenda. What is random number ( 亂數 ) ? How the random numbers generated ? rand( ) in C languages: Linear Congruential

E N D
Games, Random NumbersandIntroduction to simple statistics PRNG PseudoRandom Number Generator 蔡文能 tsaiwn@csie.nctu.edu.tw
Agenda • What is random number(亂數) ? • How the random numbers generated ? • rand( ) in C languages: Linear Congruential • Why call “Pseudo random” ? (P不發音) • How to do “true random” ? • Application of Rrandom number ? • Other topics related to Random numbers • Introduction to simple statistics (統計簡介)
BATNUM game • http://www.atariarchives.org/basicgames/showpage.php?page=14 • An ancient game of two players • One pile of match sticks (or stones) • Takes turn to remove [1, maxTake] • (至少拿 1, 至多拿 maxTake) • 可規定拿到最後一個贏或輸 ! • Winning strategy ?? Games 須用到 Random Number! Why?
Bulls and Cows Game http://5ko.free.fr/en/bk.html http://en.wikipedia.org/wiki/Bulls_and_cowshttp://zh.wikipedia.org/zh-hant/%E7%8C%9C%E6%95%B0%E5%AD%97http://boardgames.about.com/od/paperpencil/a/bulls_and_cows.htmhttp://pyva.net/eng/play/bk.htmlhttp://www.bullscows.com/index.phphttp://www.funmin.com/online-games/bulls-and-cows/index.php Games須用到 Random Number! Why?
NIM Game • http://en.wikipedia.org/wiki/Nim • Nim is a two-player mathematical game of strategy in which players take turns removing objects from distinct heaps. On each turn, a player must remove at least one object, and may remove any number of objects provided they all come from the same heap. • 可規定拿到最後一個贏或輸 ! • Winning strategy ?? Games 須用到 Random Number! Why?
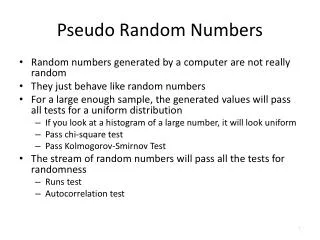
What is random number ? • Sequence of independent random numbers with a specified distribution such as uniform distribution (equally probable) • Actually, the sequence generated is not random, but it appears to be. Sequences generated in a deterministic way are usually called Pseudo-Random sequences. 參考 http://www.gnu.org/software/gsl/manual/gsl-ref_19.html Normal distribution? exponential, gamma, Poisson, …
Pseudo random number <stdlib.h> Turbo C++ 的 rand( )與srand( ) static global 變數請參考K&R課本4.6節 就是15個 1的binary #define RAND_MAX 0x7fffu static unsigned long seed=0; int rand( ) { seed = seed * 1103515245 + 12345; return seed % (RAND_MAX+1); } void srand(int newseed) { seed = newseed; } static使其它file裡的function 看不見這 seed 注意 C 語言的 rand( )生出的不是 Normal Distribution!
Pseudo random number <stdlib.h> Unix 上 gcc 的 rand( )與srand( ) static global 變數請參考K&R課本4.6節 #define RAND_MAX 0x7fffffffu static unsigned long seed=0; int rand( ) { seed = seed * 1103515245 + 12345; return seed % (RAND_MAX+1); } void srand(int newseed) { seed = newseed; } 就是31個 1的binary Pseudo random number 注意 Dev-Cpp 的 gcc 亂數只有 16 bits! 注意 C 語言的 rand( )生出的不是 Normal Distribution!
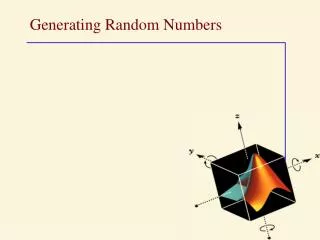
Random Number Generating Algorithms • Linear Congruential Generators • Simple way to generate pseudo-random numbers • Easily cracked • Produce finite sequences of numbers • Each number is tied to the others • Some sequences of numbers will not ever be generated • Cryptographic random number generators • Entropy sensors (i.e., extracted randomness)
Linear Congruential Generator (LCG) for Uniform Random Digits • Preferred method: begin with a seed, x0, and successively generate the next pseudo-random number by xi+1 = (axi + c) mod m, for i = 0,1,2,… where • m is the largest prime less than largest integer computer can store • a is relatively prime to m • c is arbitrary • Let [A] be largest integer less than A (就是只取整數部份), then N mod m = N – [N/T]*T • Accept LCG with m, a, and c which passes tests which are also passed by know uniform digits mod在C/C++/Java 用 %
The use of random numbers 1. Simulation 2. Recreation (game programming) 3. Sampling 4. Numerical analysis 5. Decision making randomness an essential part of optimal strategies ( in the game theory) 6. Game program, . . .
Uniform Distribution(齊一分配 ) • 在 發生的機率皆相同
Standard Normal Distribution(標準常態分配) • N(0, 1) • 平均是 0 • 標準差 1
常態分配(the Normal Distribution) • 在統計學中,最常被用到的連續分配就是常態分配。在真實世界中,常態分配常被用來描述各種變數的行為,如考試成績、體重、智商、和商店營業額等。 • 若 X 為常態隨機變數,寫成 X ~ N(,2)。 • 其中參數 為均數,2為變異數。 常態隨機變數的均數、中位數(median)、與眾數(mode)均相同。 注意 C 語言的 rand( )生出的不是 Normal Distribution!
Central Limit Theorem (CLT)(中央極限定理 ) • 如果觀察值數目 n 增加,則 n 個獨立且具有相同分配(independent and identically distributed, I.I.D.)的隨機變數(Random variable)之平均數向常態分配收斂。 樣本大小n≧30時, 趨近於常態分配。
如何用 C 生出常態分配的亂數? #include <stdlib.h> double randNormal( ) { // 標準常態分配產生器 int i; double ans =0.0; for(i=1; i<=12; ++i) ans = ans + rand( )/(1.0+RAND_MAX);return ans - 6.0; // N(0, 1) } 如何生出 N(x, std2) ?
Summary • Pseudo-Random Number Generators(PRNG) depend solely on a seed, which determines the entire sequence of numbers returned. • How to get true random ? change random seed • How random is the seed? • Process ID, UserID: Bad Idea ! • Current time: srand( time(0) ); // good If you use the time, maybe I can guess which seed you used (microsecond part might be difficult to guess, but is limited)
Introduction to simple Statistics 蔡文能 tsaiwn@csie.nctu.edu.tw
大考中心 …教育部… • 大學入學考試中心指出民國96年指考國文科較接近「常態分布」,即中等程度的人數最多、高分、低分人數較少。 • 教育部修訂資賦優異學生鑑定標準,自九十六學年度起,各類資優鑑定標準已提高為「平均數正二個標準差或百分等級九十七以上」。 請問照這樣標準 100人中大約有幾人是 "資優" ?
2010大高雄市長選舉民調 • 目前將在明年登場的大高雄市長選舉,根據《財訊》雙週刊所公佈的最新民調顯示,高雄市民有50%挺陳菊,朱立倫僅有32%支持度;若是由國民黨內佈局明年市長最明顯的立委黃昭順對上陳菊,則更有19%:60%的大段差距。 • 本次《財訊》雙週刊民調,係委託山水民意研究公司,以北、高兩市住宅電話隨機取樣,高雄市於11月2~3日進行,有效樣本1273人,在95%的信心水準下,誤差約 ±2.75個百分點。 Sampling 抽樣
2005南投縣長選舉大調查 請問您南投縣最急需改善的問題是什麼? 中時電子報是於十一月八、九、十日三天,利用電話隨機抽樣,成功訪問南投縣1103名民眾,在95%的信心水準下,正負誤差為2.95%以下。 註: 結果是李朝卿當選。 年底縣長選舉, 請問您支持哪一位參選人?
2009南投縣長選舉民調 聯合報系民意調查中心/電話調查報導 國民黨李朝卿聲勢較半個月前上揚十八個百分點,目前以四成八的支持率大幅領先民進黨李文忠的百分之三十。 這次調查於2009年11月10日至11日晚間進行,成功訪問了932位設籍南投縣的成年選民,另有262人拒訪。在百分之九十五的信心水準下,抽樣誤差在正負3.2個百分點以內。調查是以南投縣住宅電話為母體作尾數兩位隨機抽樣,調查經費來自聯合報社。
2008總統大選 蘋果民調 這是台灣《蘋果日報》委託中山大學社科院民意調查研究中心所做最新民調; 此民調針對全台20歲以上有投票權公民,進行電話訪問,調查時間為2008年1月12日“立委”選舉隔天,1月13日至16日晚上6時至10時之間,共有1054個成功樣本,在95%信心水準之下,正負誤差約3%。
2006年10月台北市長候選人民調 中時電子報是於2006/9/27到9/28,以中華民國家戶電話為樣本,成功訪問1112名居住地為台北市的受訪者。在百分之九十五的信心水準之下,正負誤差為2.9%以下。
2005台北縣長選舉民意調查 • 根據TVBS在11月21至22日的民意調查顯示,國民黨台北縣候選人周錫瑋的支持度為48%,民進黨的候選人羅文嘉則獲得27%的支持度。 • 此次民調和上月前相比,繼永洲案爆發後及日前沸騰的“瑋哥部落格(BLOG)”的抹黑,周錫瑋的支持度不降反升,多了2個百分點,羅文嘉則是下降4個百分點。 • 這份民調是TVBS民調中心在11月21日到22日間,成功訪問了1033位20歲以上的台北縣民,在95%信心水準下,抽樣誤差約為正負3.0個百分點。
背景:1936年美國總統選舉 • 法蘭克羅斯福總統爭取連任、肯薩斯州州長蘭登為共和黨總統候選人 • 美國經濟正由大蕭條中逐漸恢復 • 九百萬人失業,於1929年至1933年間實際所得降低三分之一。 • 蘭登州長選戰主軸為「小政府」。口號為The spender must go。 • 羅斯福總統選戰主軸為「擴大內需」 (deficit financing)。口號為Balance the budget of the American people first。 • 宣稱一:大部分的觀察家認為羅斯福總統將大勝 • 宣稱二:Literary Digest雜誌認為蘭登將以57%對43%贏此選戰。 • 此數字乃根據於二百四十萬人之民意調查結果。 • 該機構自1916年起,皆能依照其預測辦法作正確的預測。 • 選舉結果:羅斯福以62%對38%贏此選戰。為什麼? • 新興競爭者-蓋洛普-民調: • 依據Literary Digest雜誌所取的二百四十萬人樣本中,蓋洛普抽樣三千人,而預測蘭登將以56%對44%贏此選戰。 • 依據自己所取的五萬人樣本中,蓋洛普預測羅斯福將以56%對44%贏此選戰。
Literary Digest雜誌錯在那裡? • 取樣辦法:郵寄一千萬份的問卷,回收二百四十萬份,但問卷對象係從電話簿及俱樂部會員中選取。 • 在當時僅有一千一百萬具住宅用電話,但九百萬人失業。 可能問題的所在: • 取樣偏差:Literary Digest雜誌的取樣中包含過多的有錢人,而該年貧富間選舉傾向相距極大。 • 拒回答偏差:低回收率。 • 以芝加哥一地為例,問卷寄給三分之一的登記選民,回收約20%的問卷,其中超過一半宣稱將選蘭登(Landon),但選舉結果卻是羅斯福拿到三分之二的選票。 抽樣的樣本要多少才夠?
Sample size vs. error of estimation • When we use to construct a 95% confidence interval for , the bound on error of estimation is B = • n = • The estimated standard deviation of p is
抽樣的樣本要多少才夠? • 1- = Confidence Interval • B= the bound on error of estimation • Using a conservative value of = 0.5 in the formula for required sample size gives n = (1-) = 0.5(1-0.5) =1067.11 • Thus, n would need to be 1068 in order to estimate to within .03 with 95% confidence. 95%信心水準之下,抽樣誤差在正負3個百分點以內。
Consider this program • 台北車站廣場打算設置一台體重統計機,任何人站上去後立刻顯示其體重 • 並且立即顯示以下統計: n : 共已多少人在此量過 Average : 平均體重 STD : 這 n人的體重標準差 注意:因為可能會很多人, 所以不能把所有量過的體重都記在記憶體內, 機器也沒有硬碟或其他儲存裝置!
Distribution frequency distribution Histogram (長條圖) Central tendency Mean Median (中位數) mode (眾數) Dispersion Range Standard deviation Variance N Not P (inferential stats) Descriptive Statistics Dispersion 資料之散亂;發散 Distribution 資料之分佈; 分配 Central tendency 資料之集中趨勢
Statistics • Parameters (常見統計參數) • Mean (平均數) ─ the average of the data • Median (中位數)─ the value of middle observation • Mode (眾數) ─ the value with greatest frequency • Standard Deviation (標準差) ─ measure of average deviation • Variance (變異數) ─ the square of standard deviation • Range (範圍) ─ 例如 Max(B2:B60) ~ Min(B2:B60)?
若是全部資料而不是抽樣, 則除以 n而不是除以 n -1, 此即 population variance Mean and Variance Population Mean / Sample Mean Sample Variance
Standard Deviation • Variance describes the spread (variation) of that data around the mean. • Sample variance describes the variation of the estimates. • Standard deviations is the square root of s2 標準差就是sqrt (變異數); 阿就是變異數的平方根
Compute Variance without mean Variance = (平方和 – 和的平方/n) / n From Wikipedia.org
The Central Limit Theorem • The probability distribution of sample means is a normal distribution • If infinite number of samples with n > =30 observations are drawn from the same population where X ~ ??(μ,σ), then
Central Limit Theorem (中央極限定理) • For a population with a mean and a variance , the sampling distribution of the means of all possible samples of size ngenerated from the population will be approximately normally distributed - with the mean of the sampling distribution equal to and the variance equal to assuming that the sample size is sufficiently large.
The Normal Distribution • Described by • (mean) • (standard deviation; 標準差) • Variance 變異數 = 標準差的平方 • Write as N( , ) 或 N( , 2) • Area under the curve is equal to 1 • Standard Normal Distribution
Why is the Normal Distribution important? • It can be a good mathematical model for some distributions of real data • ACT Scores • Repeated careful measurements of the same quantity • It is a good approximation for different types of chance outcomes (like tossing a coin) • It is very useful distribution to use to model roughly symmetric distributions • Many statistical inference procedures are based on the normal distribution • Sampling Distributions are roughly normal (TBC…)
Normal Distributions and the Standard Deviation Normal Distribution Black line - Mean Red lines - 1 Std. Dev. from the mean (68.26% Interval) Green lines – 2 Std. Dev. from the mean (95.44% Interval) What about 3 Std. Dev. from the mean? 95% Confidence interval ±1.96 Std. Dev.
68.26% 95.44% - µ + -2 µ +2 99.74% -3 +3 µ 68-95-99.7 Rule for Normal Curves 68.26% of the observations fall within of the mean 95.44% of the observations fall within 2 of the mean 99.74% of the observations fall within 3 of the mean
Notations • It is important to distinguish between empirical and theoretical distributions • Different notation for each distribution
Density function of Normal Distribution • The exact density curve for a particular normal distribution is described by giving its mean () and its standard deviation () • density at x = f(x) =
Confidence Interval? (1/2) • 當我們使用軟體去模擬真實環境時,通常會用亂數(random number)模擬很多次,假設第一次模擬的結果數據是X1,第二次是X2,重覆了n次後,就有X1、X2...Xn共n個數據,這n個數據不盡相同,到底那個才是正確的? 直覺上,把得到的n個結果加總求平均,所得到的值應該比較能相信。 • 但是我們可以有多少程度的去相信這個平均值(sample mean)呢? • 這個問題討論的就是所謂的Confidence Interval (信賴區間)與顯著水準(significance level)。
Confidence Interval? (2/2) • 在實務上,想要在有限個模擬數據結果中得到一個較完美接近真實結果的數據,其實是不可能的。 • 因此我們能做的就是去求得一個機率範圍(probability bound)。若我們可以得到一個機率範圍的上限c1和一個範圍的下限c2,則就有一個很高的機率1 – α ,會使得每次所得到的模擬結果平均值μ(sample mean)都落在c1到c2的範圍之間。 Probability { c1 <= μ <= c2} = 1 –α 我們把(c1, c2)這個範圍稱為信賴區間(confidence interval); α稱為顯著水準(significance level); 100(1-α)%稱為信心水準(confidence level),用百分比表示; 1-α稱為信心係數(confidence coefficient)。
為何簡單隨機抽樣是個合理的抽樣方法? • 試想抽取16所醫院來預測393所醫院的平均出院病人數的例子, • 共有約1033種的不同樣本。 • 依據中央極限定理,所得到的平均出院病人數分佈像個鐘形曲線,其中心位於所有醫院的平均出院病人數,且大多數的16所醫院平均出院病人數都離中心(大數法則)不遠。 較有保障的抽樣辦法,被選取的樣本應使用隨機的原理取得。
Hypothesis Testing假設之檢定 • The null hypothesis for the test is that all population means (level means) are the same. (H0) • The alternative hypothesis is that one or more population means differ from the others. (H1)