Download
1 / 24
240 likes | 351 Views
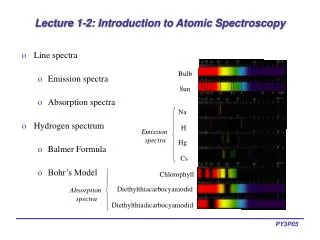
14ICPPP– Cairo, 2007 Photoacoustic spectra of Zn 1-x Be x Te near the energy gap. D. M. Todorović , T. Grozdić , Center for Multidisciplinary studies, University of Belgrade, Serbia J. Zakrzewski , F. Firszt

E N D
14ICPPP– Cairo, 2007Photoacoustic spectra of Zn1-xBexTe near the energy gap D. M. Todorović, T. Grozdić, Center for Multidisciplinary studies, University of Belgrade, Serbia J. Zakrzewski, F. Firszt Instytut Fizyki, Uniwersytet Mikołaja Kopernika, ul. Grudziadzka 5/7, 87–100 Torun, Poland M. Maliński Dep.of Electronics, Technical University of Koszalin, Sniadeckich 2, 75–328Koszalin, Poland
Abstract • This paper presents results of experimental studies of optical, thermal and structural properties in bulk mixed crystals of Zn1-xBexTe (x = 0.02, 0.06 and 0.12) using the PA microphone (PAmic) and PA piezoelectric (PApze) spectroscopy; • The amplitude and phase PA spectra were measured and analyzed in dependence on the wavelength (energy) of excitation optical beam, at different frequency of modulation. • The results of PA measurements of Zn1-xBexTe mixed crystals have been applied to determine the energy gap as a function of composition for 0<x<0.15.
II-VI mixed crystals of binary compounds with Be • The physical properties of II-VI mixed crystals of binary compounds with Be chalcogenides are of significant interest for their potential applications in technology of green semiconductor lasers; • The beryllium chalcogenides BeS, BeSe and BeTe show interesting feature, e.g. BeS has a very high hardness, BeTe is p-type semiconductor of zinc blende structure; • It has been shown that beryllium containing mixed crystals such as Zn1- xBexTe may offer a possibility of achieving a significant impact on the defect propagation and therefore the increasing of the laser structure lifetime; • Mixed crystals of II-VI binary compounds with Be chalcogenides give the possibility of tuning of band gap energies and lattice constants of these materials by adjusting Be content in the alloy. For this reason beryllium containing II-VI semiconducting compounds may offer a possibility to achieve a significant impact on the defect propagation and therefore the increasing of the laser structure lifetime. • Zn1-xBexTe alloy is a very attractive among these materials for p – cladding layers of ZnCd/MgZnCdSe lasers on InP. • The direct band gap can be changed in the range from 2.26 eV to 3.29 eV at room temperature thanks to admixing Be to ZnTe. It also results in increasing of the degree of covalent bonding, which means considerable increase of the lattice rigidity – a very important factor for reducing defect generation and propagation.
ZnBeTe samples • Crystals of Zn1-xBexTe were grown from the melt by the high pressure Bridgman method under argon overpressure (12-15 MPa) from the powdered mixture of ZnTe and Be. • The crystals were cut into 1 mm thick plates, mechanically polished and chemically etched. • A part of the samples were annealed in zinc vapor at the temperature 1230 K for 48 hours.
M S P G S PA microphone and piezoelectric detection Solid – Gas – Microphone Solid – Piezoelectric
PA microphone spectra • PA spectra were measured as a function of the wavelength, , and modulation frequency, , of excitation optical beam by standard PA spectrometer (spectrometers (EGG – PAR, PAS 6001); • PAS 6001 features a dual-beam, single-cell design, to produce maximum irradiance of the sample; • Real-time source compensation for temporal fluctuations of the light source; • A 1 kW Xenon arc lamp, electronically modulated, is the excitation source. Highly efficient all-reflective optics is used for maximum throughput; • PA spectra were normalized by PA signal of carbon black powder as a reference sample to eliminate the spectral characteristic of the Xenon arc lamp.
Photoacoustic Spectrometer Schematic depiction of PA spectrometer (EGG – PAR, PAS 6001)
Photoacoustic microphone Spectra Amplitude and phase PAmic spectra in function of energy near the energy gap for as grown crystals: ( . ) Zn1-xBexTe , x=0.02; ( * ) Zn1-xBexTe , x=0.06; ( x ) Zn1-xBexTe , x=0.12.
PA microphone Spectra – annealed crustals Amplitude and phase PAmic spectra in function of energy near the energy gap for annealed crystals: ( . ) ZnTe; ( * ) Zn1-xBexTe , x=0.02; ( x ) Zn1-xBexTe , x=0.06; ( o ) Zn1-xBexTe, x=0.12
PA microphone Spectra – as grown and annealed crustals PAmic spectra in function of energy near the energy gap for Zn1-xBexTe , x=0.12 crystals: ( * ) as grown; ( o ) annealed.
Surface state contribution model-applied for computations of the PA spectra TU(x, f, E, R, U(E), , l) • Formula for the temperature distribution being the result of the surface absorption for energies of photons below the energy gap of the semiconductor. • Typical temperature distribution formula for the volume absorption • Formulae for the microphone signal used for computations of the PA spectra
Example fittings of theoretical curves to experimental data in the volume and surface absorptions models The PAmic spectra (circles) of ZnTe (annealed) sample, the fitting curves for the volume absorption theory (dashed) and the model of surface states contribution (solid) for the parameters : Eg=2.22 eV. =1.8 um,and Urbach edge parameters 1=80 cm-1, 1=0.75. The arrow indicates the phase shift caused by the surface absorption below the energy gap.
Example fittings of theoretical curves to experimental data in the volume and surface absorptions models The amplitudeand phase of PAmic spectra of Zn 0.94Be 0.06Te for parameters: Eg=2.32 eV. =0.00019 cm ,1=120 cm-1, 1=0.055. Circles-experimental values. Dash lines-a model of the volume absorption, solid lines- a model of the surface absorption. The arrow indicates the phase shift caused by the surface absorption below the energy gap.
PA piezoelectric Spectrometer • Photoacoustic measurements were carried out using an open cell • The 300W Cermax xenon short arc lamp and monochromator in the range from λ=400 nm to λ=650 were applied as radiation source for spectroscopic measurements. • PZT transducer detected the PA signal with lock-in amplifier (Stanford SR-510) using sine wave conversion method. • All PA spectra were corrected for the spectral response of the optical system by normalizing the output signal to that of photodetector.
Piezoelectric photoacoustic spectra Photoacoustic amplitude of as-grown and annealed Zn1-xBexTe crystals for different Be content
PA amplitude (red) and phase (blue) for as-grown and annealed Zn0.93Be0.07Te for modulation frequency 126 Hz PA amplitude (red) and phase (blue) for Zn0.93Be0.07Te for different chopping frequency
Amplituide and phase of PApze signal of as-grown and annealed Zn0.879Be0.121Te mixed crystals for modulation frequency 126 Hz
Inhomogenous Sample Model Schematic diagram of the Zn 1-x Be x Te in the model of a heterogeneous sample with non-uniform concentration of Be. 1)-an inactive layer , 2) model of inhomogeneous sample , 3) beam of light
The amplitudeand phase PApze spectra of Zn 0.88 Be 0.12 Te crystal annealed in zinc vapour, measured at 126 Hz. Circles are experimental results, solid lines are theoretical curves computed in a model of inhomogeneous sample for 126 Hz , =0.4 cm2/s, R=1 and =0.002 cm.
Amplitude PApze spectra of Zn 0.93 Be 0.07 Te sample, annealed in zinc vapour and measured at f=126 Hz.. Circles–experimental results, solid line theoretical curve computed in a model of inhomogeneous sample in two crystal region approach. Parameters of computations: =0.2 cm2/s, =0.005 cm, Eg0 =2.28 eV, Eg3 =2.35 eV
Energy gap determined from PA spectra Energy gaps for ZnTe and Zn1-xBexTe crystals obtained by PA gas-microphone (PAmic) and piezoelectric (PApze) detections.
x Eg [ eV ] Thermal diffusivity [cm2/s] 0 2.28 0,119 0.006 2.29 0,302 0.065 2.32 0,338 0.121 2.48 0,272 Thermal diffusivity (D) and energy gaps of Zn1-xBexTe (annealed)
Conclusions • The measured amplitude and phase PAmic and PApze spectra of bulk Zn1-xBexTe show some similarities and also significant differencies. • The results of PA measurements in the mixed crystals have been applied to determine the energy gap values as a function of composition for 0<x<0.15. • The energy gap of Zn1‑xBexTe solid solutions monotonicallyincreases with increasing Be content • Inhomogenous sample model was applied for interpretation of piezolelectric spectra