Download
1 / 99
1.04k likes | 1.35k Views
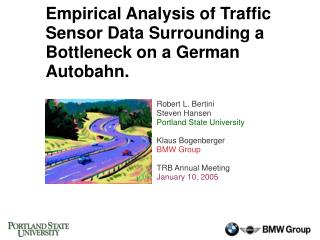
ANALYSIS OF VARIABLE SPEED LIMIT SYSTEM ON A GERMAN AUTOBAHN. Steven Boice Portland State University M.S. Civil Engineering Candidate A Thesis defense presented in the partial fulfillment of the requirements for the degree of MASTER OF SCIENCE in CIVIL ENGINEERING July 28, 2008.

E N D
ANALYSIS OF VARIABLE SPEED LIMIT SYSTEM ON A GERMAN AUTOBAHN Steven Boice Portland State University M.S. Civil Engineering Candidate A Thesis defense presented in the partial fulfillment of the requirements for the degree of MASTER OF SCIENCE in CIVIL ENGINEERING July 28, 2008
Presentation Outline • Introduction • Study Area • Methodology • Analysis • Results • Outlook ANALYSIS OF VARIABLE SPEED LIMIT SYSTEM ON A GERMAN AUTOBAHN
Presentation Outline • Introduction • Study Area • Methodology • Analysis • Results • Outlook ANALYSIS OF VARIABLE SPEED LIMIT SYSTEM ON A GERMAN AUTOBAHN
IntroductionVariable Speed Limit System • Speed limits that change based on real time road, traffic, and weather conditions • Road • Slippery pavement, visibility • Traffic • Density, speed, truck percentages • Weather • Rain, snow, ice, fog • Speed limits, advisories, regulatory prohibitions presented to drivers via overhead gantries • Sign centered over each lane • Enforced via radar/camera • Speed limit changes based on series of algorithms • Speed limits change in order to: • Postpone or prevent freeway breakdown • Reduce shock speeds • Increase lane homogeneity (speed/flow) • Increase safety • Increase capacity ANALYSIS OF VARIABLE SPEED LIMIT SYSTEM ON A GERMAN AUTOBAHN
IntroductionVariable Speed Limit System • Speed limits, advisories, regulatory prohibitions presented to drivers via overhead gantries • Sign centered over each lane ANALYSIS OF VARIABLE SPEED LIMIT SYSTEM ON A GERMAN AUTOBAHN
IntroductionThesis Objective • Address VSL impacts on key traffic flow parameters • Bottleneck location/reoccurrence • Bottleneck properties (shock speed, pre-queue flow, queue discharge flow) • Lane harmonization (flow/speed) • Address by conducting empirical before/after analysis on a German Autobahn • Use real data collected from roadway sensors along Autobahn 99 with VSL in and out of operation ANALYSIS OF VARIABLE SPEED LIMIT SYSTEM ON A GERMAN AUTOBAHN
Variable Speed Limit: Concept Maintain constant flow ANALYSIS OF VARIABLE SPEED LIMIT SYSTEM ON A GERMAN AUTOBAHN
IntroductionThesis Motivation • VSL - Germany, United Kingdom, Netherlands, Australia • Large emphasis on safety • Large decrease in rear end crashes • Large decrease in speed differential • 20-30% reduction in crash rates (Germany) • 30% reduction in injury crashes (M25 U.K.) • Little emphasis on impacts of traffic flow parameters • 15% increase in shoulder lane (M25 U.K.) • Increase in weekday traffic volumes (M25 U.K.) • No improvement in freeway performance (A2 Netherlands) ANALYSIS OF VARIABLE SPEED LIMIT SYSTEM ON A GERMAN AUTOBAHN
IntroductionThesis Background • Graduate Research Assistant • Intelligent Transportation Systems Laboratory • Empirical Analysis of German and U.S. traffic sensor data and impact on Driver Assistance Systems • Funded by BMW • Analysis of A9 • Rodger Lindgren • Analysis of A5 • “Connections” allowed for access to A99 data • Opportunity to compare US and German freeways ANALYSIS OF VARIABLE SPEED LIMIT SYSTEM ON A GERMAN AUTOBAHN
Outline • Introduction • Study Area • Methodology • Analysis • Results • Outlook ANALYSIS OF VARIABLE SPEED LIMIT SYSTEM ON A GERMAN AUTOBAHN
Study AreaAutobahn 99 - Munich, Germany A99 Study Area A99 = ¾ ring around City of Munich, Germany ANALYSIS OF VARIABLE SPEED LIMIT SYSTEM ON A GERMAN AUTOBAHN
Study AreaAutobahn 99 • Constructed in 1930’s • Total 41 kilometers (A995 to A96) • ¾ ring around city of Munich • Considered one of busiest roadways in Europe • ADT = ? • No ramp metering • Connects roadways to City of Munich • A96 • A8 • A92 • A9 • A94 • A995 ANALYSIS OF VARIABLE SPEED LIMIT SYSTEM ON A GERMAN AUTOBAHN
Study AreaA99 Site Facts ANALYSIS OF VARIABLE SPEED LIMIT SYSTEM ON A GERMAN AUTOBAHN
740 750 710 (AQ) 730 714 780 760 690 770 720 750 730 710 786 720 780 760 210 714 772 740 690 70 (MQ) (m) 2197 2030 750 1300 720 1130 1464 1120 1130 1720 1629 320 37 30 Northbound Southbound 37 290 37 1540 468 945 626 930 1075 1357 1110 1250 2250 (m) 1460 1650 1280 (MQ) 170 232 190 60 220 140 210 80 70 90 120 150 110 130 90 190 (AQ) 120 110 210 60 70 80 170 140 150 130 Legend: variable message sign gantry hard shoulder dual-loop detector station Study AreaAutobahn 99 (hard shoulder) Lane opened in dense traffic ANALYSIS OF VARIABLE SPEED LIMIT SYSTEM ON A GERMAN AUTOBAHN
Southbound 37 290 37 1540 468 945 626 930 1075 1357 1110 1250 2250 (m) 1460 1650 1280 (MQ) 170 232 190 60 220 140 210 80 70 90 120 150 110 130 90 190 (AQ) 120 110 210 60 70 80 170 140 150 130 Legend: variable message sign gantry hard shoulder dual-loop detector station Study AreaAutobahn 99 ANALYSIS OF VARIABLE SPEED LIMIT SYSTEM ON A GERMAN AUTOBAHN
Outline • Introduction • Study Area • Methodology • Analysis • Results • Outlook ANALYSIS OF VARIABLE SPEED LIMIT SYSTEM ON A GERMAN AUTOBAHN
MethodologyA99 Data Summary ANALYSIS OF VARIABLE SPEED LIMIT SYSTEM ON A GERMAN AUTOBAHN
MethodologyA99 Data Summary ANALYSIS OF VARIABLE SPEED LIMIT SYSTEM ON A GERMAN AUTOBAHN
MethodologyTransformed cumulative curves • Transformed cumulative curves (e.g. Newell, Cassidy & Windover) • Vehicle count • Time-averaged speed • Transformations to heighten visual resolution: • Oblique axis • Horizontal shift with vehicle conservation • Retain highest level of resolution (one-minute) • Identify bottleneck activations and deactivations. ANALYSIS OF VARIABLE SPEED LIMIT SYSTEM ON A GERMAN AUTOBAHN
Bottleneck: Definition • An “active” bottleneck is a restriction that separates upstream queued traffic from downstream un-queued traffic • An “active” bottleneck is de-activated when there is either a decrease in demand or when a queue spills back from a downstream bottleneck ANALYSIS OF VARIABLE SPEED LIMIT SYSTEM ON A GERMAN AUTOBAHN
MethodologyTransformed Cumulative Curves N(x,t) ANALYSIS OF VARIABLE SPEED LIMIT SYSTEM ON A GERMAN AUTOBAHN
MethodologyTransformed Cumulative Curves N(x,t) q0=5180 vph N(x,t)-q0t´ ANALYSIS OF VARIABLE SPEED LIMIT SYSTEM ON A GERMAN AUTOBAHN
MethodologyTransformed Cumulative Curves Time 14:00 14:15 14:30 14:45 15:00 15:15 15:30 15:45 16:00 11,000 10,000 9,000 8,000 N(x,t)-q0t´ 7,000 6,000 5,000 N(x,t) Cumulative Count 4,000 3,000 2,000 1,000 0 ANALYSIS OF VARIABLE SPEED LIMIT SYSTEM ON A GERMAN AUTOBAHN
0 -50 -100 -150 -200 -250 -300 MethodologyTransformed Cumulative Curves Time 14:00 14:15 14:30 14:45 15:00 15:15 15:30 15:45 16:00 N(x,t)-q0t´ N(x,t) Cumulative Count ANALYSIS OF VARIABLE SPEED LIMIT SYSTEM ON A GERMAN AUTOBAHN
N(x1,t) Travel Direction N(xj,t) x x Trip Timej 1 2 j N(x2,t) Number t1 Time, t Ref. Veh. Trip Time MethodologyQueuing Diagram ANALYSIS OF VARIABLE SPEED LIMIT SYSTEM ON A GERMAN AUTOBAHN
MethodologyQueuing Diagram N(x1,t) Travel Direction N(xj,t) x x Excess Accumulation 1 2 k N(x2,t) Excess Travel Time=Delay Time, t t2 ANALYSIS OF VARIABLE SPEED LIMIT SYSTEM ON A GERMAN AUTOBAHN
Southbound 290 37 37 1075 1540 626 945 1110 2250 1357 1650 930 468 1460 (m) 1280 1250 (MQ) 60 90 140 170 232 70 80 120 150 190 210 110 130 220 (AQ) 80 90 120 60 70 110 140 170 190 210 150 130 MethodologyTime Space Diagram Speed (km/hr) ANALYSIS OF VARIABLE SPEED LIMIT SYSTEM ON A GERMAN AUTOBAHN
MethodologyTime Space Diagram Warning/Prohibition (km/hr) 1 = Speed 60 km/hr 2 = No passing Trucks 3 = 4= ANALYSIS OF VARIABLE SPEED LIMIT SYSTEM ON A GERMAN AUTOBAHN
MethodologyFlow - Occupancy ANALYSIS OF VARIABLE SPEED LIMIT SYSTEM ON A GERMAN AUTOBAHN
Outline • Introduction • Study Area • Methodology • Analysis • Results • Outlook ANALYSIS OF VARIABLE SPEED LIMIT SYSTEM ON A GERMAN AUTOBAHN
Analysis • bottleneck location/reoccurrence • Bottleneck characteristics • Shock speed, prequeue, queue discharge • Lane harmonization (flow/speed) ANALYSIS OF VARIABLE SPEED LIMIT SYSTEM ON A GERMAN AUTOBAHN
Go through 1 Bottleneck Diagnosis • Show audience how it is done • Walk them through October 16, 2003 southbound • Include slides similar to A9 slides (included for June 27, 2002) • Show how shock speed, pre-queue, and queue discharge flows are calculated (see A9 slides) • Diagnosis • Walk audience through 1 diagnosis • Walk audience through what VSL system was doing ANALYSIS OF VARIABLE SPEED LIMIT SYSTEM ON A GERMAN AUTOBAHN
Speeds Northbound A9June 27, 2002 630 ANALYSIS OF VARIABLE SPEED LIMIT SYSTEM ON A GERMAN AUTOBAHN
Speeds Northbound A9June 27, 2002 1 ANALYSIS OF VARIABLE SPEED LIMIT SYSTEM ON A GERMAN AUTOBAHN
Bottleneck Activation June 27, 2002Station 380 420 450 390 380off 350 Station 380 + Off Ramp 250 N(x,t)-q0t′,q0=5170 veh/hr 150 50 Time -50 630 14:45 14:50 14:55 15:00 15:05 15:10 15:15 15:20 15:25 15:30 15:35 15:40 15:45 15:50 ANALYSIS OF VARIABLE SPEED LIMIT SYSTEM ON A GERMAN AUTOBAHN
Bottleneck Activation June 27, 2002Stations 380–390–420 Station 420 + On Ramp Station 390 Station 380 + Off Ramp N(x,t)-q0t′,q0=5170 veh/hr Time 630 ANALYSIS OF VARIABLE SPEED LIMIT SYSTEM ON A GERMAN AUTOBAHN
Bottleneck Activation June 27, 2002Stations 380–390–420 15:21@ Station 390 15:21@ Station 380 Flow Reduction @380 N(x,t)-q0t′,q0=5170 veh/hr Time 630 ANALYSIS OF VARIABLE SPEED LIMIT SYSTEM ON A GERMAN AUTOBAHN
380 70 km/h 15:21 89 km/h V(380,t)-b0t′,b0=3300 km/hr2 Time 15:15 15:20 15:25 15:30 Bottleneck Activation June 27, 2002Station 380 Speed 630 ANALYSIS OF VARIABLE SPEED LIMIT SYSTEM ON A GERMAN AUTOBAHN
Bottleneck Activation June 27, 2002Stations 380–390–420 15:24@ Station 420 15:21@ Station 390 15:21@ Station 380 380 55600 70 89 15:21 V(380,t)-b0t′,b0=3300 km/hr2 55400 Flow Reduction @380 N(x,t)-q0t′,q0=5170 veh/hr Time 55200 15:15 15:20 15:25 15:30 390 98220 80 41 V(390,t)-b0t′,b0=4335 km/hr2 98170 15:21 98120 Time 15:15 15:20 15:25 15:30 420 95110 65 92 V(420,t)-b0t′,b0=4850 km/hr2 95060 15:24 Time 95010 Time 15:15 15:20 15:25 15:30 630 ANALYSIS OF VARIABLE SPEED LIMIT SYSTEM ON A GERMAN AUTOBAHN
540 29800 39 V(540,t)-b0t′,b0=4550 km/hr2 97 29600 15:34 Time 29400 15:15 15:20 15:25 15:30 15:35 15:40 15:45 560 43 83 36620 V(560,t)-b0t′,b0=3550 km/hr2 15:41 36520 Time 36420 15:30 15:35 15:40 15:45 15:50 15:55 16:00 580 34480 43 87 34380 V(580,t)-b0t′,b0=3650 km/hr2 15:42 34280 Time 34180 15:30 15:35 15:40 15:45 15:50 15:55 16:00 600 32700 38 72 32600 V(600,t)-b0t′,b0=3450 km/hr2 15:47 32500 Time 32400 15:30 15:35 15:40 15:45 15:50 15:55 16:00 630 41850 20 93 15:58 V(630,t)-b0t′,b0=3100 km/hr2 41650 Time 41450 15:45 15:50 15:55 16:00 16:05 16:10 16:15 Bottleneck Activation June 27, 2002 630 ANALYSIS OF VARIABLE SPEED LIMIT SYSTEM ON A GERMAN AUTOBAHN
540 29800 39 V(540,t)-b0t′,b0=4550 km/hr2 97 29600 15:34 Time 29400 15:15 15:20 15:25 15:30 15:35 15:40 15:45 560 43 83 36620 V(560,t)-b0t′,b0=3550 km/hr2 15:41 36520 Time 36420 15:30 15:35 15:40 15:45 15:50 15:55 16:00 580 34480 43 87 34380 V(580,t)-b0t′,b0=3650 km/hr2 15:42 34280 Time 34180 15:30 15:35 15:40 15:45 15:50 15:55 16:00 600 32700 38 72 32600 V(600,t)-b0t′,b0=3450 km/hr2 15:47 32500 Time 32400 15:30 15:35 15:40 15:45 15:50 15:55 16:00 630 41850 20 93 15:58 V(630,t)-b0t′,b0=3100 km/hr2 41650 Time 41450 15:45 15:50 15:55 16:00 16:05 16:10 16:15 Bottleneck Activation June 27, 2002 1 15:21 15:24 15:34 15:41 15:42 15:47 15:58 630 ANALYSIS OF VARIABLE SPEED LIMIT SYSTEM ON A GERMAN AUTOBAHN
Bottleneck Activation June 27, 2002Stations 320–340–350–380 N(x,t)-q0t′,q0=5170 veh/hr Station 380 + On-Ramp Station 350 Station 340 Station 320 + Off-Ramp Time 630 Time @ station 380 ANALYSIS OF VARIABLE SPEED LIMIT SYSTEM ON A GERMAN AUTOBAHN
Bottleneck Activation June 27, 2002Stations 320–340–350–380 N(x,t)-q0t′,q0=5170 veh/hr 15:21@ Station 380 Flow Reduction @380 Time 630 Time @ station 380 ANALYSIS OF VARIABLE SPEED LIMIT SYSTEM ON A GERMAN AUTOBAHN
320 104 15:27 19790 105 V(320,t)-b0t′,b0=6000 km/hr2 19740 Time 19690 15:15 15:20 15:25 15:30 15:35 15:40 15:45 340 15:26 97 22420 V(340,t)-b0t′,b0=5600 km/hr2 99 22370 Time 22320 15:15 15:20 15:25 15:30 15:35 15:40 15:45 350 15:23 84 40700 84 V(350,t)-b0t′,b0=4200 km/hr2 40600 40500 Time 15:15 15:20 15:25 15:30 Bottleneck Activation June 27, 2002Stations 320–340–350–380 N(x,t)-q0t′,q0=5170 veh/hr 15:21@ Station 380 15:23@ Station 350 Flow Reduction @380 15:27@ Station 320 15:26@ Station 340 Time 630 Time @ station 380 ANALYSIS OF VARIABLE SPEED LIMIT SYSTEM ON A GERMAN AUTOBAHN
Bottleneck Activation June 27, 2002 • Active bottleneck located between detectors 380 and 390. • Activated at 15:21. • Queue propagated as far as detector 630. • Unrestricted traffic downstream. 630 ANALYSIS OF VARIABLE SPEED LIMIT SYSTEM ON A GERMAN AUTOBAHN
Bottleneck ActivationJune 27, 2002 17:28 1 17:35 19:40 15:21 17:38 18:44 19:18 15:24 17:40 15:34 15:41 15:42 15:47 15:58 630 Direction of Travel ANALYSIS OF VARIABLE SPEED LIMIT SYSTEM ON A GERMAN AUTOBAHN
Bottleneck ActivationJune 27, 2002 2 17:28 1 17:35 19:40 15:21 17:38 18:44 19:18 15:24 17:40 15:34 15:41 15:42 15:47 15:58 630 Direction of Travel ANALYSIS OF VARIABLE SPEED LIMIT SYSTEM ON A GERMAN AUTOBAHN
Bottleneck ActivationJune 27, 2002 2 17:28 1 17:35 3 19:40 15:21 17:38 18:44 19:18 15:24 17:40 15:34 15:41 15:42 15:47 15:58 630 Direction of Travel ANALYSIS OF VARIABLE SPEED LIMIT SYSTEM ON A GERMAN AUTOBAHN
Bottleneck ActivationJune 27, 2002 2 17:28 4 1 17:35 3 19:40 15:21 17:38 18:44 19:18 15:24 17:40 15:34 15:41 15:42 15:47 15:58 630 Direction of Travel ANALYSIS OF VARIABLE SPEED LIMIT SYSTEM ON A GERMAN AUTOBAHN
Bottleneck Activation June 27, 2002Stations 380–390–420 N(x,t)-q0t, q0=5178 veh/hr N(420,t) N(390,t) 100 N(380,t) 0 Time 15:00 16:00 17:00 18:00 19:00 630 ANALYSIS OF VARIABLE SPEED LIMIT SYSTEM ON A GERMAN AUTOBAHN