Download
1 / 30
300 likes | 462 Views
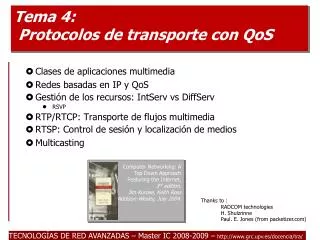
Redes Inalámbricas – Tema 2.A The radio channel. Antennas Bands Characteristics of the wireless channel Fading Propagation models Power budget. Decibels.

E N D
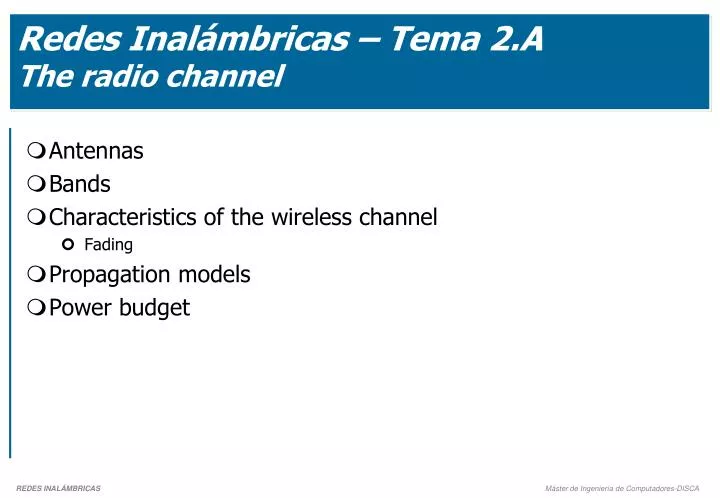
Redes Inalámbricas – Tema 2.AThe radio channel Antennas Bands Characteristics of the wireless channel Fading Propagation models Power budget
Decibels • The decibel (dB) is a logarithmic unit of measurement that expresses the magnitude of a physical quantity (usually power or intensity) relative to a specified or implied reference level. Since it expresses a ratio of two quantities with the same unit, it is a dimensionless unit. • Gains adds instead of multiply • Example: computing the T-R attenuation • PT=100, PR=10 • [PT/PR]dB = 10 log(PT/PR) = 10 log(10) = 10 dB • Useful values: • [1/2]dB -3 dB • [1/1000]dB= -30 dB • Expressing absolute values: • [n mW]dBm = [n/mW]dBEj.: [1mW]dBm = 0 dBm • [n W]dBW = [n/W]dBEj.: [1 mW]dBW= -30 dBW • From decibels to power: P = 10dB/10 • An interesting web page: • http://www.phys.unsw.edu.au/jw/dB.html 10log1/2
Redes Inalámbricas – Tema 2.AThe radio channel Antennas Bands Characteristics of the wireless channel Fading Propagation models Power budget
Antennas: basic concepts • Non Isotropic Antenna • Radiates power only in a section of the surrounding space. • Isotropic Antenna • In free space radiates power equally in all direction. YAGI Directional Antenna • d- distance directly away from the antenna. • is the azimuth, or angle in the horizontal plane. • is the zenith, or angle above the horizon. d
/4 /2 y y z simple dipole x z x side view (xy-plane) side view (yz-plane) top view (xz-plane) Antennas: Simple Dipoles • Not isotropic radiators but, e.g., dipoles with lengths /4 on car roofs or /2 as Hertzian dipole • Example: Radiation pattern of a simple Hertzian dipole • shape of antenna proportional to wavelength • Thanks to: Professor Z Ghassemlooy, School of Computing, Engineering and Information Sciences University of Northumbria, U.K.
y y z Directed x z x side view (xy-plane) side view (yz-plane) top view (xz-plane) z z Sectorized x x top view, 3 sector top view, 6 sector Antennas: directed and sectorized • Used for microwave or base stations for mobile phones (e.g., radio coverage of a valley) • Thanks to: Professor Z Ghassemlooy, School of Computing, Engineering and Information Sciences University of Northumbria, U.K.
Long reach antenas Parabolic Antenna (20 dBi) Reach: 10 Km at 2 Mb/s 4,5 Km at 11 Mb/s Yagi antenna (13,5 dBi) Reach: 6 Km at 2 Mb/s 2 Km at 11 Mb/s
More examples Horizontal Radiation Forwalls (8,5 dBi) Reach: 3 Km at 2 Mb/s 1 Km at 11 Mb/s
Redes Inalámbricas – Tema 2.AThe radio channel Antennas Bands Characteristics of the wireless channel Fading Propagation models Power budget
Bandswithoutlicense in USA • Industrial, Scientific, and Medical (ISM) • 902 – 928 MHz band. • Currently not being used for WLAN • 2400 – 2483.5 MHz ISM band. • Unlicensed National Information Infrastructure (UNII): • 5.15 – 5.25 GHz. • 5.25 – 5.35 GHz. • 5.725 – 5.850 GHz ISM band.
Bandswithoutlicense in Europa • Bandsapprovedbythe CEPT (EuropeanConference of Postal and TelecommunicationsAdministrations) • 2400 – 2483.5 MHz, basedon ISM. • 5.15 – 5.35 GHz. • 5.470 – 5.725 GHz. • U N - 51 Aplicaciones ICM por encima de 2,4 GHz • Bandas de frecuencias designadas para aplicaciones industriales, científicas, y médicas (Aplicaciones ICM, no servicios de radiocomunicaciones). • 2400 a 2500 MHz (frecuencia central 2450 MHz) • 5725 a 5875 MHz (frecuencia central 5800 MHz) • 24,00 a 24,25 GHz (frecuencia central 24,125 GHz) • 61,00 a 61,50 GHz (frecuencia central 61,250 GHz) • Los servicios de radiocomunicaciones (notas UN-85, 86, 130 y 133) que funcionen en las citadas bandas deberán aceptar la interferencia perjudicial resultante de estas aplicaciones. • La utilización de estas frecuencias para las aplicaciones indicadas se considera uso común. • http://www.mityc.es/Telecomunicaciones/Secciones/Espectro/cnaf/ Short Wave Radio FM Broadcast Infrared wireless LAN AM Broadcast Television Audio Cellular (840MHz) NPCS (1.9GHz) Low Medium High Infrared X-Rays Extremely Low Very Low Very High Ultra High Super High Visible Light Ultra- violet 2.4 - 2.4835 GHz 83.5 MHz (IEEE 802.11) 5 GHz (IEEE 802.11) HyperLAN HyperLAN2
5.15 5.25 5.35 5.470 5.725 5.825 5 GHz UNII Band Detailsaboutthe 5 GHz band 4 Channels 4 Channels 11 Channels 4 Channels US (FCC) 12 Channels (*can use up to 6dBi gain antenna) UNII-1 40mW (22 dBm EIRP) UNII-2 200mW (29 dBm EIRP) UNII-3 800mW (35 dBm EIRP) Europe 19 Channels (*assumes no antenna gain) 200mW 1W UNII-1: Indoor Use, antenna must be fixed to the radio UNII-2: Indoor/Outdoor Use, fixed or remote antenna UNII-3: Outdoor Bridging Only (EIRP limit is 52 dBm if PtP) *if you use a higher gain antenna, you must reduce the transmit power accordingly
Redes Inalámbricas – Tema 2.AThe radio channel Antennas Bands Characteristics of the wireless channel Fading Propagation models Power budget
Channel code word Message Signal Modulated Transmitted Signal Source Encoder Channel Encoder Mod- ulator Source Wireless Channel Source Decoder Channel Decoder Demod- ulator User Received Signal Estimate of Message signal Estimate of channel code word Wireless Communication System • Thanks to: Professor Z Ghassemlooy, School of Computing, Engineering and Information Sciences University of Northumbria, U.K.
Characteristics of the wireless channel • The wireless channel suffers basically from the effects of the following two phenomena: • Distance Path attenuation • Multipath or scattering over time due to the differing paths of the signal • Other effects: diffraction, obstruction, reflection Theodore S. Rappaport , “Wireless Communications : Principles and Practice”, Prentice Hall, T R The green signal travels 1/2 more than the yellow line. The receiver receives the red line.Forf = 2,4 GHz, = c/f = 12.5cm
Diffraction • Diffraction is normally taken to refer to various phenomena which occur when a wave encounters an obstacle. • It is described as the apparent bending of waves around small obstacles and the spreading out of waves past small openings • The complex patterns resulting from the intensity of a diffracted wave are a result of the superposition, or interference of different parts of a wave that traveled to the observer by different paths T R 1st Fresnel zone Obstruction Numerical approximation of diffraction pattern from a slit of width four wavelengths with an incident plane wave. The main central beam, nulls, and phase reversals are apparent.
Fading • The terms slow and fast fading refer to the rate at which the magnitude and phase change imposed by the channel on the signal changes. • Slow fading arises when the coherence time of the channel is large relative to the delay constraint of the channel. • In this regime, the amplitude and phase change imposed by the channel can be considered roughly constant over the period of use. • Example: a large obstruction such as a hill or large building obscures the main signal path between the transmitter and the receiver. • Fast fading occurs when the coherence time of the channel is small relative to the delay constraint of the channel. • In this regime, the amplitude and phase change imposed by the channel varies considerably over the period of use.
Comparison Exponencial 0.1 -1 m (10-100 msecs) Power Fast Fading Slow Fading 10-100 m (1-10 secs) Distance
Coherence time • Temporal coherence is the measure of the average correlation between the value of a wave at any pair of times, separated by delay τ. • In other words, it characterizes how a wave can interfere with itself at a different time. The delay over which the phase or amplitude wanders by a significant amount (and hence the correlation decreases by significant amount) is defined as the coherence time τc. • At τ=0 the degree of coherence is perfect whereas it drops significantly by delay τc.
Coherence time and doppler spread • The coherence time of the channel is also related to a quantity known as the Doppler spread of the channel. • When a user is moving, the user's velocity causes a shift in the frequency of the signal transmitted along each signal path. This phenomenon is known as the Doppler shift. Signals travelling along different paths can have different Doppler shifts. • The difference in Doppler shifts between different signal components contributing to a single fading channel tap is known as the Doppler spread. • Channels with a large Doppler spread have signal components that are each changing independently in phase over time. Since fading depends on whether signal components add constructively or destructively, such channels have a very short coherence time. • In general, coherence time is inversely related to Doppler spread, typically expressed as • where Tc is the coherence time, Ds is the Doppler spread, and k is a constant taking on values in the range of 0.25 to 0.5.
Delay Spread • When radio waves bounce off objects, several echos of the wave will converge on the receiver. The difference between the first wave's arrival and the last arrival is the delay spread. Receivers can pick through the noise to find the signal, but only if the delay spread is not excessive. Some vendors also quote the maximum delay spread on their data sheets. Table below reports the delay spread for three of the cards listed above. • Cards rated for higher delay spreads are capable of dealing with worse multipath interference. The Cisco Aironet 350 was an extremely capable card for its day, capable of dealing with over twice the time-smearing as the Hermes-based card. (from 802.11 Wireless Networks: The Definitive Guide, Matthew Gast)
Module 2.The radio channel Antennas Bands Characteristics of the wireless channel Fading Propagation models Power budget
Free spacepropagation • Computing the received power when LOS between T and R • “signal attenuation without considering all the effects of diffraction, obstruction, reflection, scattering.” • Friis formula:
T R d0 d df Pathloss • Path loss (or path attenuation) is the reduction in power density (attenuation) of an electromagnetic wave as it propagates through space. Path loss is a major component in the analysis and design of the link budget of a telecommunication system. • Computing pathloss: PL(d) = PL (d0)+10nlog(d/d0) (dB) • PL(d0) isobtainedfromFriis formula consideringGt=Gr=L=1:
T R d0 d df Pathloss: a fewexamples • Given: d=10km, f=900MHz, • l=c/f = 3*108/9*108 = 1/3m • d0=1km PL(d0) = 20log(4p1000/l) = 91,5 dB • free space n=2 • PL(d) = PL (d0)+10nlog(d/ d0) = 91,5 + 10*2*log(10000/1000) = 111,5 dB • Urban area n=3.5 • PL(d) = PL (d0)+10nlog(d/ d0) = 91,5 + 10*3.5*log(10000/1000) = 126,5 dB
Log-normal shadowing • The amplitude change caused by shadowing is often modeled using a log-normal distribution with a standard deviation according to the log-distance path loss model. • Where Xs is a Gaussian variable with (m=0, s) • Therefore:
Module 2.The radio channel Antennas Bands Characteristics of the wireless channel Fading Propagation models Power budget
PA RA Ptx Gpa GTXA Lpath Grxa Gra Sr RX TX Gtxl Grxl PowerBudget • Prx = Ptx+Gpa-Gtxl+Gtxa-Lpath+Grxa+Gra-Grxl • Ptx[dBm]=Power generated by TX • Gpa[dB]=Gain of the Power Amplifier • Gtxa[dBi]=Gain of TX antenna • Gtxl[dB]=Gain (loss) of transmission line • Lpth[dB]=Loss of the transmission medium • Grxa[dBi]=Gain of RX antenna • Gra[dB]=Gain of the Receive Amplifier • Grxl[dB]=Gain (loss) of receiving line • Prx[dBm]=Power received • Sr[dBm]=Sensivity of receiver Gtxl • Must hold the condition Prx > Sr EIRP(Effective Isotropically Radiated Power)= Ptx+Gpa+Gtxa-Gtxl