Download
1 / 13
130 likes | 147 Views
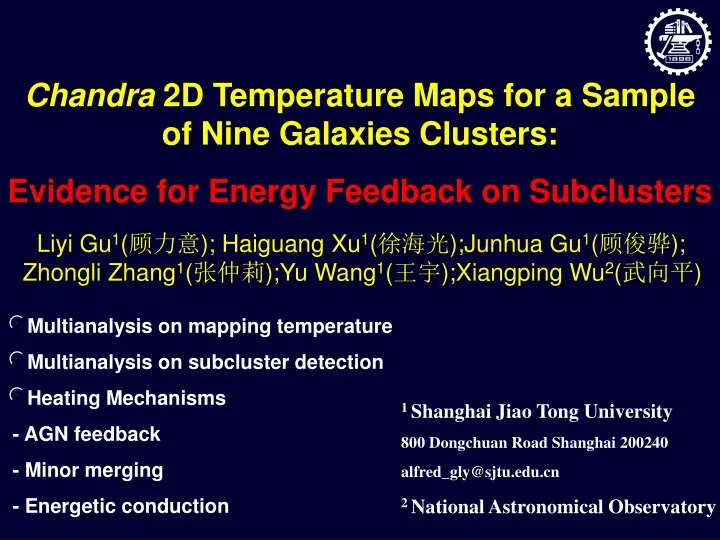
This study presents detailed 2D temperature maps of nine galaxies clusters using Chandra data, revealing evidence for energy feedback mechanisms on subclusters. The research delves into various heating mechanisms such as AGN feedback, minor merging, and energetic conduction, shedding light on the processes influencing the thermal energy distribution within galaxy clusters.

E N D
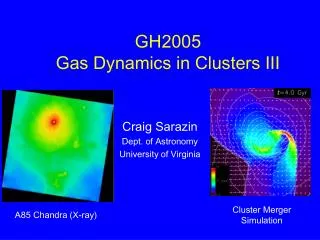
Chandra 2D Temperature Maps for a Sample of Nine Galaxies Clusters: Evidence for Energy Feedback on Subclusters Liyi Gu1(顾力意); Haiguang Xu1(徐海光);Junhua Gu1(顾俊骅); Zhongli Zhang1(张仲莉);Yu Wang1(王宇);Xiangping Wu2(武向平) • Multianalysis on mapping temperature • Multianalysis on subcluster detection • Heating Mechanisms - AGN feedback - Minor merging - Energetic conduction 1 Shanghai Jiao Tong University 800 Dongchuan Road Shanghai 200240 alfred_gly@sjtu.edu.cn 2 National Astronomical Observatory
Introduction: Gas Heating in Galaxy Clusters 1 Peterson et al. (2001) Peterson & Fabian (2005) The non-detection of the expected amount of desposed gas cooling down to low temperature was affirmed by recent XMM-Newton observations.(e.g. Peterson et al. 2001,2003; Kaastra et al. 2001; Peterson & Fabian 2005). Heating agents (like AGNs) required to offset the inherent cooling are restudied more explicitly, thanks to the high spatial resolution of Chandra.
A478, z~0.088 A1068, z~0.137 A1201, z~0.168 A1650, z~0.084 A2104, z~0.155 A2204, z~0.153 2 A2244, z~0.096 A2556, z~0.087 A3112, z~0.075 Our Sample • Nine relaxed Abell clusters of galaxies (z~0.7-0.16) withX-ray data drawn from the Chandra archive • DSS optical images with smoothed X-ray contours overlapped
Fluctuation Structures and Correlations 3 2D temperature maps • By associating the background-subtracted event lists with emission model we derive the temperature distribution in the central region ~ 400 kpc. • The model used in the fits is1-TAPECabsorbed by the Galactic NH. • Contours overlapped in the maps of the right side show the 1-sigma covariance based on Chi-square statistic. CVT binning (Cappellari etal. 2003) Adaptive smoothing
shot-noise subtracted spectra reference spectra raw spectra Jing (2005) Fourier fluctuation spectra 2D temperature fluctuations K/ Wavelet space decompositions:
2-Gaussian kernel observed data Haar kernel azimuthally randomized data Two-point correlation function Wavelet decomposition • Amplitude excesses in the scale of 50 ~ 200 kpc
example Hot gas regions - member galaxy correlation A1650 Distance of excess correlation significance: Cool gas regions - member galaxy correlation R ~ 50 – 100 kpc Further cross-correlation examinations: Further cross-correlation applications: Possiblecorrelation between the temperature structures and member galaxy distributions Combining data refer to five clusters, A478, A1650, A2104, A2556, A3112 Possible off-center hot gas correlated member galaxies
example The excess thermal energy is estimated by multiplying the residual excess pressure by the volume, (Sanderson et al. 2004) Combining all regions studied in one typical cluster, the total excess energy generally attains several 1059~1060 erg. Eexcess≈ Pexcess× V Excess thermal energy estimation 5 1 4 3 2
4 Discussion Possible heating sources: AGN feedbacks • Active galactic nuclei (AGNs) drive outflows in the form of jets that inflate lobes with hot plasma. • Almost all regular clusters host a central radio source, sometimes very weak (Eilek, 2004). ThreeHOTSPOTS Jet turbulence (Reynolds et al. 2002, Casse & Marcowith 2004) Inflating bubbles (Quilis et al. 2001, Bruggen et al. 2002, Robinson et al. 2003,Pizzolato & Soker 2006) Sound waves (Ruszkowski et al. 2003)
Theoretically verification examples A478 A2104 154 kpc 262 kpc 36 kpc 250 kpc Pizzolato et al. 2006 144 kpc The analysis predicts: The life time T ≥ 108 yrs Bubble’s final location RC ~ 100 kpc Bubble’s final radius RS ~ 50 kpc Broadly consistent with our results! Bubbles/bubble remnants ? Possible bubbles/bubble remnants arising in several 107 ~ 108 yrs Average distance: 165 kpc • The bubble rising time to this radius, • With the buoyancy velocity: ~2 ×10⁸ yrs; • With sound speed: ~1×10⁸ yrs; Positions of the 100kpc-scale structures
A478 A1201 A2204 A1650 A2244 ≠ Additional Evidences example A2104 The wakes of ‘ghost bubbles’ can be also observed in other four clusters as follow:
5 Conclusion • A wealthy amount of subcluster structures 50 – 200 kpc in size, mostly outside the central gas halo • Several 1058 -1059 ergs of thermal energy required per substructure • The plural origin, AGN feedback via bubble dissipation, minor merging activities, SNe…