Download
1 / 33
330 likes | 556 Views
Phytoplankton, Zooplankton and Benthos Communities in Lake Superior. M.L. Tuchman 1 & R.P. Barbiero 2 1 USEPA GLNPO, Chicago, IL USA 2 DynCorp I&ET, Chicago, IL USA. G reat L akes N ational P rogram O ffice. USEPA Monitoring Began in 1983 Current Sampling Includes: Phytoplankton

E N D
Phytoplankton, Zooplankton and Benthos Communities in Lake Superior M.L. Tuchman1 & R.P. Barbiero2 1USEPA GLNPO, Chicago, IL USA 2DynCorp I&ET, Chicago, IL USA
Great Lakes National Program Office • USEPA • Monitoring Began in 1983 • Current Sampling Includes: • Phytoplankton • Zooplankton • Benthos • Physical/Chemical Parameters • Biannual Sampling • Spring mixed • Summer stratified
Plankton Sites Plankton & Benthos Sites Benthos Only Sites 1998 Summer Sampling Stations
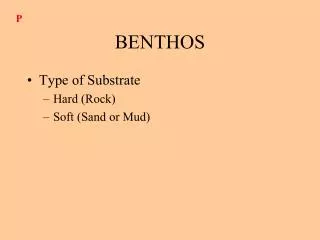
TOPICS • Focus on: • Offshore Waters • Spring; Summer • Communities Examined: • Phytoplankton: biovolume; development • Crustacean: composition, size structure • Benthos: status of Diporeia • Current Status - Results from 1999 Survey
Plankton Plankton & Benthos Benthos Locations of GLNPO Routine Monitoring Sites
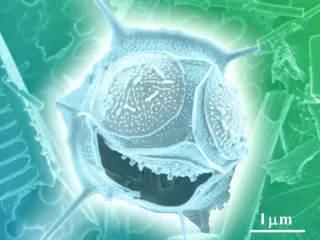
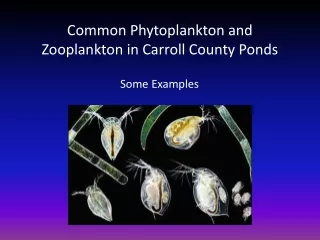
Major Types of Diatoms Centrics Cyclotella Aulacoseira Pennates Fragilaria Asterionella Tabellaria
Phytoplankton Biovolume, Spring 1998 4 3 Biovolume (106mm3/ml) 2 1 0 2*106mm3/ml SU MI HU ER ON 1*106mm3/ml 5*105mm3/ml
Biovolume (106mm3/ml) 4 3 2*106mm3/ml 2 1*106mm3/ml 5*105mm3/ml 1 0 SU MI HU ER ON Phytoplankton Biovolume, Spring 1999
Phytoplankton Biovolume, Summer 1998 4 3 Biovolume (106mm3/ml) 2 1 2*106mm3/ml 0 SU MI HU ER ON 1*106mm3/ml 5*105mm3/ml
Phytoplankton Biovolume, Summer 1999 4 3 2*106mm3/ml 1*106mm3/ml 2 5*105mm3/ml 1 0 SU MI HU ER ON Biovolume (106mm3/ml)
100 100 100 75 75 75 50 50 50 25 25 25 0 0 0 SU MI HU ER ON SU MI HU ER ON SU MI HU ER ON Cryptophytes Diatoms OTHER Chlorophytes Cyanophytes Chrysophytes Dinoflagellates Relative Composition of Phytoplankton Communities 1999 1998 Spring Percent Composition 100 75 Summer 50 25 0 SU MI HU ER ON
Phytoplankton - Conclusions • Biomass Low Relative to Other Lakes • Lower in spring than summer • Development Of Phytoplankton Community Delayed • Diatoms Persist Further Into Season • Summer Community Most Similar to Huron
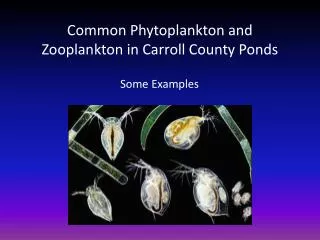
Cladocerans Daphnia retrocurva Bosmina longirostris Photo: SMSU Photo: Dr. Paul Hebert
Copepods Mesocyclops Diaptomus Photo: SMSU Photo: USGS
3 g/m2 1 g/m2 Cladocerans Calanoida Cyclopoida Imm Cyclopoida Imm Calanoida Biomass of Spring Crustaceans 1999
3 g/m2 1 g/m2 Cladocerans Calanoida Cyclopoida Imm Cyclopoida Imm Calanoida Biomass of Summer Crustaceans 1999
2 g/m2 1 g/m2 < 0.4 g/m2 100 75 50 Percent Abundance Cladocerans 25 Calanoida Imm Calanoida 0 Cyclopoida SU MI HU W C E ON ER Imm Cyclopoida Biomass of Spring Crustaceans 1999
100 75 Percent Abundance 50 25 0 SU MI HU W C E ON ER Cladocerans Calanoida Imm Calanoida Cyclopoida Imm Cyclopoida 10 g/m2 5 g/m2 < 1.5 g/m2 Biomass of Summer Crustaceans 1999
5 Biomass (g/m2) 0 15 10 Biomass (g/m2) 5 0 SU MI HU ER ON Comparison of Crustacean Biomass in the Great Lakes, 1999 Spring Summer
Relative Frequency Cumulative Biomass 30 30 100 100 75 75 20 20 50 50 Size (mm) 10 10 25 25 0 0 0 0 < 1 mm 0 0 1 1 2 2 3 3 > 1 mm Bythotrephes 30 100 75 20 50 10 25 0 0 0 1 2 3 Size Frequency Distribution and Cumulative Biomass of Summer Crustaceans 1999 30 100 75 20 50 10 25 0 0 0 1 2 3
100 20 75 50 10 25 0 100 0 100 20 20 75 75 50 50 10 10 25 25 0 0 0 100 0 1 2 3 20 75 50 10 25 0 0 0 1 2 3 100 20 75 50 10 25 0 100 20 75 50 10 25 0 0 0 1 2 3 Size Frequency Distribution and Cumulative Biomass of Summer Crustaceans 1998, 1999 1998 1999
Amount of Biomass Contributed by Individuals < 1 mm and > 1 mm, Summer, 1998 % Biomass SU MI HU ER ON < 1 mm > 1 mm Bythotrephes 10 g/m2 5 g/m2 <1 g/m2
% Biomass SU MI HU ER ON < 1 mm > 1 mm Bythotrephes 10 g/m2 5 g/m2 <1 g/m2 Amount of Biomass Contributed by Individuals < 1 mm and > 1 mm, Summer, 1999
1,000/m2 500/m2 100/m2 + absent Bythotrephes Areal Abundances 1999
Zooplankton - Conclusions • Community Makeup: • Large, deep-living calanoid copepods dominate • Cyclopoid copepods also abundant • Percentage of cladocerans lowest of Great Lakes • Biomass Low Relative to Other Lakes • Most Biomass in Large Individuals • ‘Medium’ Sized Individuals Largely Absent
14000 12000 10000 8000 Abundance/m2 6000 4000 2000 0 SU MI HU ER ON 12,000/m2 8,000/m2 4,000/m2 Areal Abundances of Benthos in the Great Lakes, Summer 1999
6,000 m-2 3,000 m-2 1,000 m-2 + 0 m-2 Abundance of Diporeia Throughout Great Lakes, 1999
- 2000 #/m2 1000 0 Changes in Diporeia Abundance, 1997-1999 - + +/-
Better Than SOLEC Criteria Meets SOLEC Criteria Worse Than SOLEC Criteria SOLEC Criteria: Depth < 100m: 220-320/m2 Depth > 100m: 30-160/m2 Diporeia Abundance in Relation to SOLEC Criteria, 1999