Download
1 / 16
250 likes | 779 Views
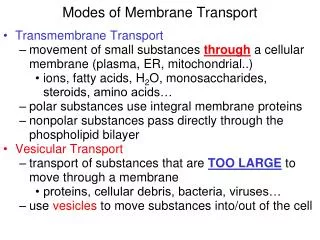
Modes of Sediment Transport. Modes of Sediment transport. Sediments are transported as, Bed load transport The bed load is the part of the total load that is more or less in contact with the bed during the transport. It primarily includes grains that roll, slide or bounce along the bed.

E N D
Modes of Sediment Transport www.assignmentpoint.com
Modes of Sediment transport Sediments are transported as, • Bed load transport The bed load is the part of the total load that is more or less in contact with the bed during the transport. It primarily includes grains that roll, slide or bounce along the bed. • experiment and theory suggest that the rate of bedload transport (qb) is proportional to the cube of the shear velocity, • i.e. qb ∝ u *3 ……………………………………………….A www.assignmentpoint.com
Suspended load transport. It is the part of the total load that is moving in suspension without continuous contact with the bed. • The determination of the rate of suspended load transport is straightforward by comparison with measurement of the rate of bedload transport. • Wash load transport • It consists of very fine particles transported in water. www.assignmentpoint.com
Figure 2 www.assignmentpoint.com
Longshore drift • It is the movement of sediments most often sand, along a coast parallel to its shoreline - a zig-zag movement of sediment along the beach . • The largest beach sediment is found where the process begins, updrift, and the smallest, most easily moved, downdrift. • Where waves are strong, the coast will be eroded and sediment carried away and where they are weak sediment will be deposited. • Longshore drift can have undesirable effects for humans, such as beach erosion. To prevent this, sea defences such as groynes or gabions may be employed. www.assignmentpoint.com
Where beaches have become severely eroded by longshore drift and little material is replaced by natural processes, then the material may be artificially replaced by beach nourishment. • Net rate: • Gross rate: www.assignmentpoint.com
Model theories for the calculation of longshore drift are • Energy flux model • Energetic model • Suspended transport model www.assignmentpoint.com
Energy flux model • It is the simplest model used for the calculation of total amount of material moved along the shoreline. • It is based on the amount of energy available in the waves arriving at the shoreline. • The flux energy in the wave direction is determined to be as Ϝ dl, • where • Ϝ -the energy flux of the waves per unit crest width(Ϝ=ECg), • E - the energy per unit surface area= ξgH2/8 • ρ –the water density www.assignmentpoint.com
g-acceleration due to gravity • Cg-Group velocity • To determine the amount of this energy flux per unit length of coastline consider the figure, www.assignmentpoint.com
dx=dl/cosθ, • where θis the angle the wave ray makes with the onshore(y)direction. • Now it is supposed that the energy flux in the alongshore direction is responsible for the longshore sediment transport; therefore we multiply the energy flux per unit legth(dx=unity) of beach by sinθ to obtain • Ϝcosθsinθ= Pl=ECgsinθcosθ= (ρ gCgsin2θ)/16 www.assignmentpoint.com
For many years this alongshore energy flux per unit length of beach,Pl was correlated empirically with the volume sand moved by the waves. • Amount material moved, • Q= CPnl..................................................................................B • Where C is a dimensional constant of proportionality. The power n has been found to be close to unity. • equation A as being dimensionally incorrect. Then corrected the equation as • Q=KPl/[(ρ s- ρ)g(1-p)] www.assignmentpoint.com
Where -p is the porosity of the sediment, which is typically about .3 to .4. the porosity is introduced to convert sand weight to sad volume, taking into account the voids that occur with in the sand. • K-is the dimensionless parameter, its value ranging from 0.2 to 2. www.assignmentpoint.com
Longshore Sediment transport rate at different locations in India • Longshore sediment transport rate (LSTR) reported for different locations along the Indian coast shows local reversals in the transport direction in a number of locations along the west coast. • It was found that the annual gross sediment transport rate was high (»1 * 106m3) along the coast of south Orissa and south Kerala. www.assignmentpoint.com
Sediment transport rate at different locations in India • Location Net transport Gross transport (m3/yr) (m3/yr) • West coast of India • Kalbadevi 118,580 South 147,621 • Ambolgarh 189,594 South 299,997 • Vengurla 53,040 South 120,141 • Calangute 90,000 South 120,000 • Colva 160,000 North 160,000 • Arge 69,350 North 200,773 • Gangavali 142,018 South 177,239 • Kasarkod 40,186 North 77,502 • Maravanthe 25,372 North 29,836 www.assignmentpoint.com
Kasargod 736,772 South 958,478 • Kannur 19,434 South 561,576 • Kozhikode 114,665 South 256,697 • Nattika 192,818 North 660,276 • Andhakaranazhi 202,096 South 599,484 • Alleppey 16,929 North 62,519 • Kollam 383,784 South 805,296 • Thiruvananthapuram 99,159 North 1231,153 • Kolachel 302,400 West 946,500 www.assignmentpoint.com
East coast of India • Ovari 1,500 South 251,300 • Tiruchendur 64,100 North 87,500 • Kannirajapuram 117,447 North 145,979 • Naripayur 36,600 South 122,500 • Muthupettai 5,200 South 8,900 • Poompuhar 146,000 North 478,800 • Pondichery 134,400 North 237,000 • Periyakalapet 486,900 North 657,600 • Tikkavanipalem 177,000 North 405,000 • Gopalpur 830,046 North 949,520 • Prayagi 887,528 North 997,594 • Puri 735,436 North 926,637 www.assignmentpoint.com