Download
1 / 20
200 likes | 216 Views
Learn about one-to-one functions, their inverses, and how to determine if a function is one-to-one in this comprehensive guide. Understand the concept of inverses, graphing inverse functions, and solving for inverse values.

E N D
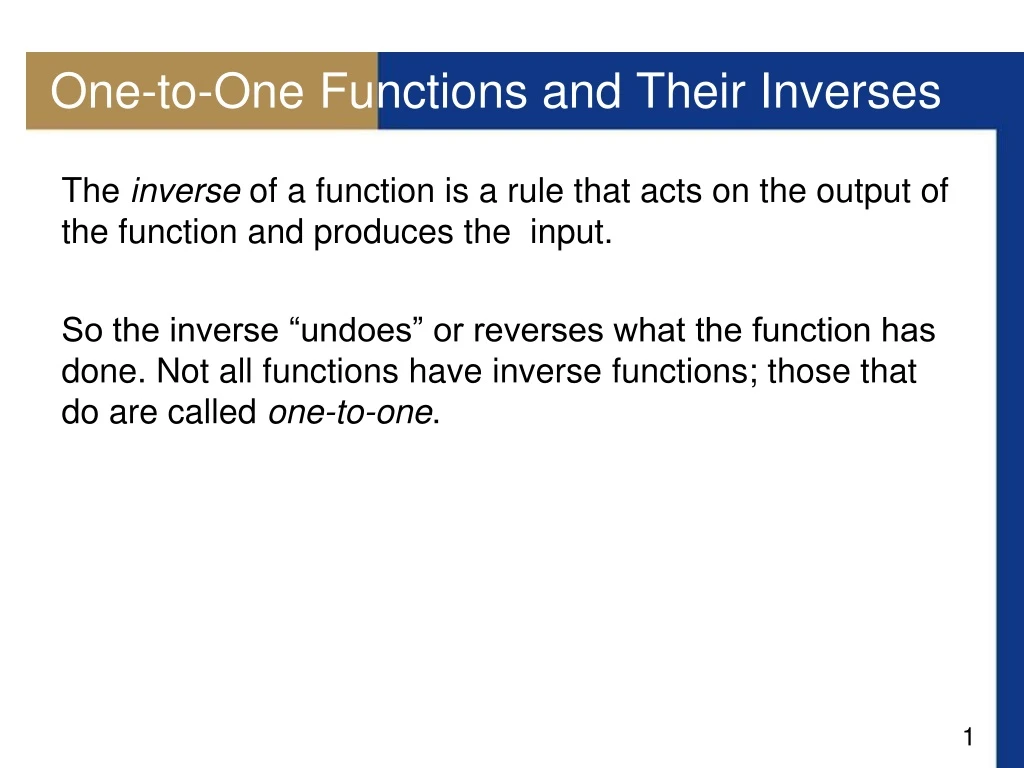
One-to-One Functions and Their Inverses • The inverse of a function is a rule that acts on the output of the function and produces the input. • So the inverse “undoes” or reverses what the function has done. Not all functions have inverse functions; those that do are called one-to-one.
One-to-One Functions • Let’s compare the functions f and g‘s arrow diagrams
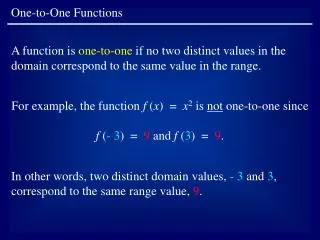
One-to-One Functions • Note that f never outputs the same value twice, whereas g does take on the same value twice (both 2 and 3 have the same output, 4). • Whenever x1 ≠ x2, it must be true that f(x1) ≠ f(x2) • Functions with this property are called one-to-one.
One-to-One Functions • An equivalent way of writing the condition for a one-to-one function is this: • If f(x1) = f(x2), then x1 = x2.
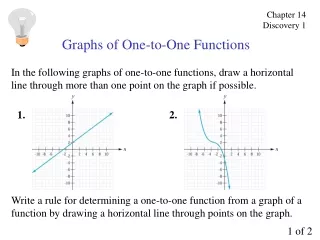
One-to-One Functions • If a horizontal line intersects the graph of f at more than one point, then we see from Figure 2 that there are numbers x1 ≠ x2 such that f(x1) = f(x2) . This function is not one-to-one because f(x1) = f(x2).
Example 1 – Deciding Whether a Function Is One-to-One • Is the function f(x) = x3 one-to-one? • Solution: we see that no horizontal line intersects the graph of f(x) = x3 more than once. Therefore, by the Horizontal Line Test, f is one-to-one. • Notice that the function f is increasing, • it can be proved that every increasing • function and every decreasing function • is one-to-one. f(x) = x3 is one-to-one.
The Inverse of a Function • One-to-one functions are important because they possess inverse functions
The Inverse of a Function • This definition says that if f takes x to y, then f–1 takes y back to x. • domain of f–1 = range of f • range of f–1 = domain of f
Example 4 – Finding f–1 for Specific Values • If f(1) = 5, f(3) = 7, and f(8) = –10, find f–1(5), f–1(7), and f–1(–10). • Solution: • From the definition of f–1 we have • f–1(5) = 1 because f(1) = 5 • f–1(7) = 1 because f(3) = 5 • f–1(–10) = 8 because f(8) = –10
Example 4 – Solution cont’d • f–1 reverses the effect of f • Don’t mistake the –1 in f–1 for an exponent. • f–1(x) does not mean • The reciprocal 1/f(x) is written as (f(x))–1. Figure 7
The Inverse of a Function • By definition the inverse function f–1 undoes what f does: If we start with x, apply f, and then apply f–1, we arrive back at x, where we started. Similarly, f undoes what f–1 does. • These properties indicate that f is the inverse function of f–1, so we say that f and f–1 are inverses of each other. • Now let’s examine how we compute inverse functions. • If we then interchange x and y, we have y = f–1(x), which is the desired equation.
The Inverse of a Function • Note that Steps 2 and 3 can be reversed. In other words, we can interchange x and y first and then solve for y in terms of x. (most common method!)
Finding the Inverse of f(x) = 3x – 2 • First write y = f(x) y = 3x – 2 • We interchange x and y x= 3y – 2 • Solve this equation for y. 3y = x + 2 • Therefore, the inverse function is f–1(x) =
Finding the Inverse of • First we write y =(2x + 3)/(x – 1) and interchange x & y. • x = (2y + 3)/(y – 1) • x(y – 1) = 2y + 3 • xy – x = 2y + 3 Expand • xy – 2y = x + 3Bring y-terms to LHS • y(x – 2) = x + 3 • y = Solve for y • the inverse function is f–1(x) = Multiply by y – 1 Factor y
Graphing the Inverse of a Function • The principle of interchanging x and y to find the inverse function also gives us a method for obtaining the graph off–1 from the graph of f. • If f(a) = b , then f–1(b) = a. Thus, the point (a, b) is on the graph of f if and only if the point (b, a) is on the graph of f–1.
Graphing the Inverse of a Function • We get the point (b, a) from the point (a, b) by reflecting in the line y = x .
Example 9 – Graphing the Inverse of a Function • (a) Sketch the graph of f(x) = . • (b) Use the graph of f to sketch the graph of f–1. • (c) Find an equation for f–1. • Solution: • (a) We sketch the graph of by plotting the graph of the function y = and moving it to the right 2 units.
Example 9 – Solution cont’d • (b) The graph of f–1 is obtained from the graph of f in part (a) by reflecting it in the line y = x, as shown in Figure 10. Figure 10
Example 9 – Solution cont’d • (c) Interchange x and y; y = , noting that y 0. • = x • y – 2 = x2 • y = x2 + 2 y 0 y – 2 Square each side Add 2
Example 9 – Solution cont’d • Interchange x and y: • y = x2 + 2 x 0 • Thus f–1 = x2 + 2 This expression shows that the graph of f–1 is the right half of the parabola y = x2 + 2, and from the graph shown this is reasonable.