Download
1 / 25
250 likes | 413 Views
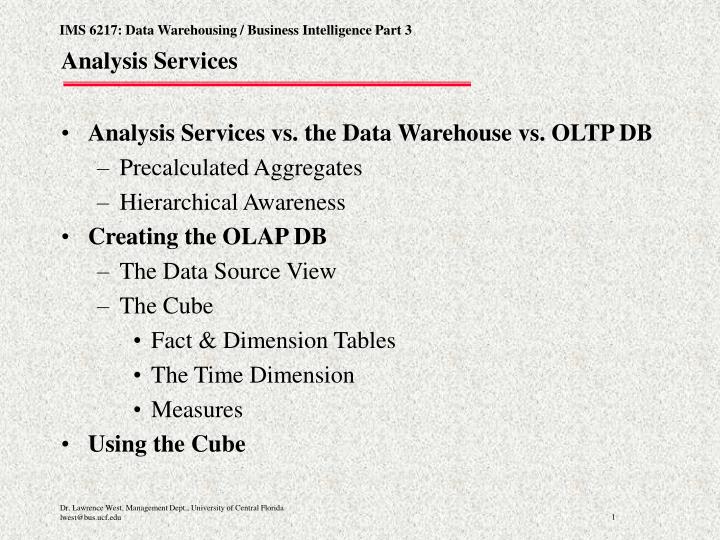
Analysis Services. Analysis Services vs. the Data Warehouse vs. OLTP DB Precalculated Aggregates Hierarchical Awareness Creating the OLAP DB The Data Source View The Cube Fact & Dimension Tables The Time Dimension Measures Using the Cube. Analysis Services—Why we Care.

E N D
Analysis Services • Analysis Services vs. the Data Warehouse vs. OLTP DB • Precalculated Aggregates • Hierarchical Awareness • Creating the OLAP DB • The Data Source View • The Cube • Fact & Dimension Tables • The Time Dimension • Measures • Using the Cube
Analysis Services—Why we Care • Three levels of data sources for analysis • All three are separate copies of the data • Each has advantages/disadvantages & purposes • Source data • OLTP relational databases • Other source data including external • Data Warehouse • Source data integrated • Still a relational database • Analysis Services (OLAP) Database
Analysis Services—Why we Care (cont.) • Data Warehouse Strengths • Integrated data • 'Scrubbed' data • Shortened relationship paths→Simpler queries • Optimized for queries rather than throughput • Data Warehouse Limitations • Still a relational database • Performance lags when querying and summing millions of records
The OLAP / Analysis Services Approach • In their simplest forms OLAP databases have a logical structure similar to the star or snowflake schema we saw in the DW • Fact tables • Dimension tables • Data storage structure is wildly different from relational DBMS • Fact/Dimension tables are stored in 'cubes' • Multi-dimensional (not just three) relationships between fact and dimension tables • Preprocessed aggregates stored in DB
The OLAP / Analysis Services Approach (cont.) • Recall that fact tables contain • Keys that indicate dimensionality of the data • Measures that contain values of interest • We will design Cubes based arounda single fact table • Other approaches acceptable including multi-fact table cubes
The OLAP / Analysis Services Approach (cont.) • The OLAP engine is aware of • The relationship between the values in the dimensional key columns and the measures in the fact table • Every sale is for one • Time Key • Customer Key • etc • Hierarchies in dimensional tables • Country→State →City • Year →Month →Date
Precalculated Aggregates • The OLAP Engine precalculates aggregates along dimensions in the fact table • If querying total sales value by customer andproduct this value may already be stored for each combination of customer and product • Aggregates are calculated and stored during processing of the cube (later)
Intelligent Hierarchies • OLAP intelligently uses precalculated aggregates to total on hierarchies • If aggregates are already calculated for sales by product by customer… • … sales by product by country use the precalculated aggregate rather than querying the detail data • There are special tools for establishing hierarchical relationships among time dimension components • Relationships in snowflake schema will be automatically detected • Others can be established at design time
Creating the OLAP DB • Create the OLAP DB from the DW • They can also be created directly from source data • Use Business Intelligence Development Studio to design, create, and load the OLAP DB • The Visual Studio project contains the definitions needed to design, create, and load • The project also creates the Analysis Services DB • SQL Server & Analysis Services must both be running
Creating the OLAP DB (cont.) • Steps • Create Analysis Services Project with connection(s) • Create Data Source View to define data to be loaded • Generate OLAP DB • Load OLAP DB • OLAP DB available for use • Direct browsing • Serving via Analysis Services server • Reporting Services • Excel
Creating the OLAP DB • NewBusinessIntelligenceProject • Type isAnalysisServices • Manageproject filelocations
Create Data Source(s) for the Project • Create a data source just as we didfor the data warehouse load project • Point the data source to the data warehouse DB • Create new connection if necessary • Select "Default" Impersonation Information if DW DB does not require login
Create the Data Source View • The Data Source View (DSV) is a map from the source data (data warehouse in our case) to the OLAP DB • May include data transformations • Allows fact data and dimensions to be identified • Allows hierarchies to be established • Special tools for time hierarchies • Create new DSV in Solution Explorer • Set Data Source
Create Data Source View (cont.) • Select fact tableto be loaded • Select dimension tables • Use Add RelatedTables button • Manually select • Include hierarchicaltables as necessaryfrom snowflakeschema • Name DSV when all tables are selected
Create Data Source View (cont.) • DSV template iscreated from theselected tables • Template may bemodified • Add calculatedcolumns • Ready to add newcube when DSVis complete
Create Cube • Create new cube from Solution Explorer • Select Build cube from data source • Select the DSVthat was created tobe the basis for thenew cube
Build Cube—Confirm Fact & Dimension Tables • Confirm suggestedfact and dimensiontables • Wizard frequentlymisidentifies dimension tablesas fact tables • Just check • Be sure to identifythe Time DimensionTable
Build Cube—Map Time Dimension Columns • Time has built in hierarchies • Map the Time Dimcolumns to thepredefined timehierarchical concepts • Not all will bemapped
Build Cube—Identify Measures • Uncheck spuriouscolumns that willnot be used as measures in thefact table • Next step detectshierarchies • No operatorchoices
Build Cube—Review Hierarchies • The hierarchiesscreen allows you toreview, delete, &modify hierarchies
Building the Cube—Name the Cube • Give the cube ameaningful name • Default is the sameas the DSV which should probably notbe used • Click Finish to build the cube design
Building the Cube—Reviewing Cube Design • The cube structure tab will show the cube design in a way that looks much like the DSV • Any changes will be reflected • Calculated columns • Renamed columns
Processing the Cube • The cube must be processed before it can be used • Select Process… from the Cube menu • On first run you will be prompted to build and deploy the project first • Select Run from the Process Cube dialog • This may take some time—this is where the data is being loaded into the OLAP DB and initial aggregations created
Demonstrations • Browser • Reporting Services • Excel Access to OLAP DB • Do Your Own • Build a Cube around the Adventure Works DW Internet Sales Fact Table