Download
1 / 23
300 likes | 659 Views
Maximum Likelihood Estimation. Berlin Chen Department of Computer Science & Information Engineering National Taiwan Normal University. References: 1. Ethem Alpaydin, Introduction to Machine Learning , Chapter 4, MIT Press, 2004. Population (sample space). Sample. Inference. Statistics.

E N D
Maximum Likelihood Estimation Berlin Chen Department of Computer Science & Information Engineering National Taiwan Normal University References: 1. Ethem Alpaydin, Introduction to Machine Learning , Chapter 4, MIT Press, 2004
Population (sample space) Sample Inference Statistics Parameters Sample Statistics and Population Parameters • A Schematic Depiction
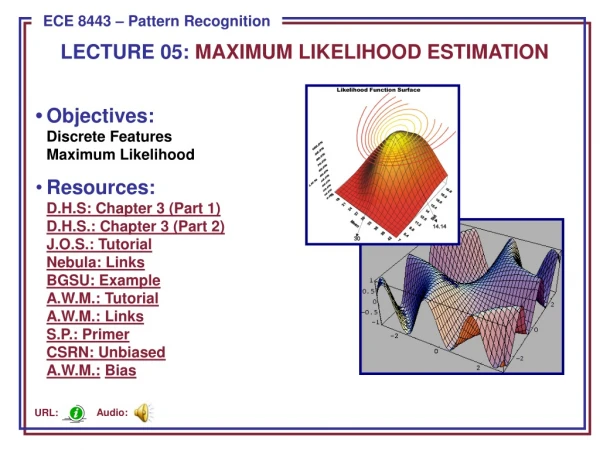
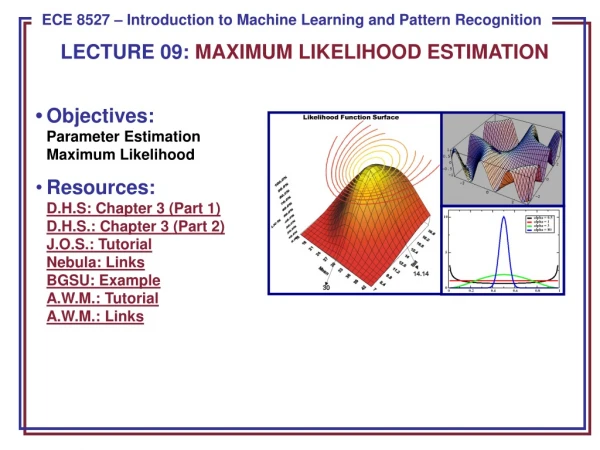
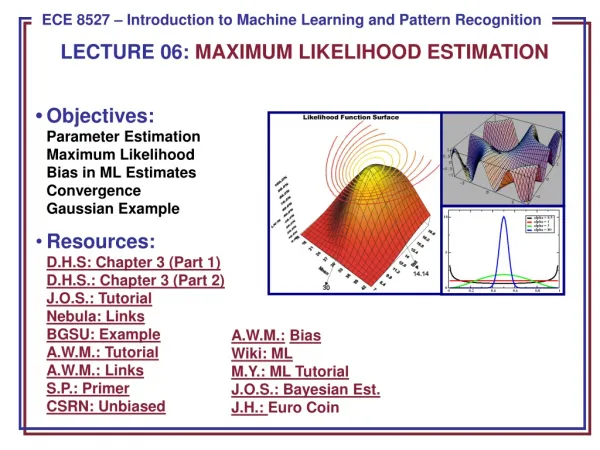
Introduction • Statistic • Any value (or function) that is calculated from a given sample • Statistical inference: make a decision using the information provided by a sample (or a set of examples/instances) • Parametric methods • Assume that examples are drawn from some distribution that obeys a known model • Advantage: the model is well defined up to a small number of parameters • E.g., mean and variance are sufficient statistics for the Gaussian distribution • Model parameters are typically estimated by either maximum likelihood estimation (MLE) or Bayesian (MAP) estimation
Maximum Likelihood Estimation (MLE) (1/2) • Assume the instances are independent and identically distributed (iid), and drawn from some known probability distribution • : model parameters (assumed to be fixed but unknown here) • MLE attempts to find that make the most likely to be drawn • Namely, maximize the likelihood of the instances
MLE (2/2) • Because logarithm will not change the value of when it take its maximum (monotonically increasing/decreasing) • Finding that maximizes the likelihood of the instances is equivalent to finding that maximizes the log likelihood of the sample instances( that best fits the instances) • As we shall see, logarithmic operation can further simplify the computation when estimating the parameters of those distributions that have exponents
Bernoulli Distribution A random variable takes either the value (with probability ) or the value (with probability ) Can be thought of as is generated form two distinct states The associated probability distribution The log likelihood for a set of iid instances drawn from Bernoulli distribution MLE: Bernoulli Distribution (1/3)
MLE: Bernoulli Distribution (2/3) • MLE of the distribution parameter • The estimate for is the ratio of the number of occurrences of the event ( ) to the number of experiments • The expected value for • The variance value for
MLE: Bernoulli Distribution (3/3) • Appendix A The maximum likelihood estimate of the mean is the sample average
MLE: Multinomial Distribution (1/4) • Multinomial Distribution • A generalization of Bernoulli distribution • The value of a random variable can be one of K mutually exclusive and exhaustive states with probabilities , respectively • The associated probability distribution • The log likelihood for a set of iid instances drawn from a multinomial distribution
MLE: Multinomial Distribution (2/4) • MLE of the distribution parameter • The estimate for is the ratio of the number of experiments with outcome of state ( ) to the number of experiments Urn
MLE: Multinomial Distribution (3/4) • Appendix B Lagrange Multiplier =1 Lagrange Multiplier: http://www.slimy.com/~steuard/teaching/tutorials/Lagrange.html
MLE: Multinomial Distribution (4/4) Urn P(B)=3/10 P(W)=4/10 P(R)=3/10
MLE: Gaussian Distribution (1/3) • Also called Normal Distribution • Characterized with mean and variance • Recall that mean and variance are sufficient statistics for Gaussian • The log likelihood for a set of iid instances drawn from Gaussian distribution
MLE: Gaussian Distribution (2/3) • MLE of the distribution parameters and • Remind that and are still fixed but unknown sample average sample variance
MLE: Gaussian Distribution (3/3) • Appendix C
Evaluating an Estimator : Bias and Variance (1/6) • The mean square error of the estimator can be further decomposed into two parts respectively composed of bias and variance constant constant 0 variance bias2
Evaluating an Estimator : Bias and Variance (3/6) • Example 1: sample average and sample variance • Assume samples are independent and identically distributed (iid), and drawn from some known probability distribution with mean and variance • Mean • Variance • Sample average (mean) for the observed samples • Sample variance for the observed samples for discrete random variables estimator estimate ?
Evaluating an Estimator : Bias and Variance (4/6) • Example 1 (count.) • Sample average is an unbiased estimator of the mean • is also a consistent estimator:
Evaluating an Estimator : Bias and Variance (5/6) • Example 1 (count.) • Sample variance is an asymptotically unbiased estimator of the variance
Evaluating an Estimator : Bias and Variance (6/6) • Example 1 (count.) • Sample variance is an asymptotically unbiased estimator of the variance The size of the observed sample set
Bias and Variance: Example 2 different samples for an unknown population error of measurement
Big Data => Deep Learning (Deep Neural Networks, etc.) complicated or sophisticated modeling structures Simple is Elegant ? Occam’s razor favors simple solutions over complex ones.