Download
1 / 16
160 likes | 285 Views
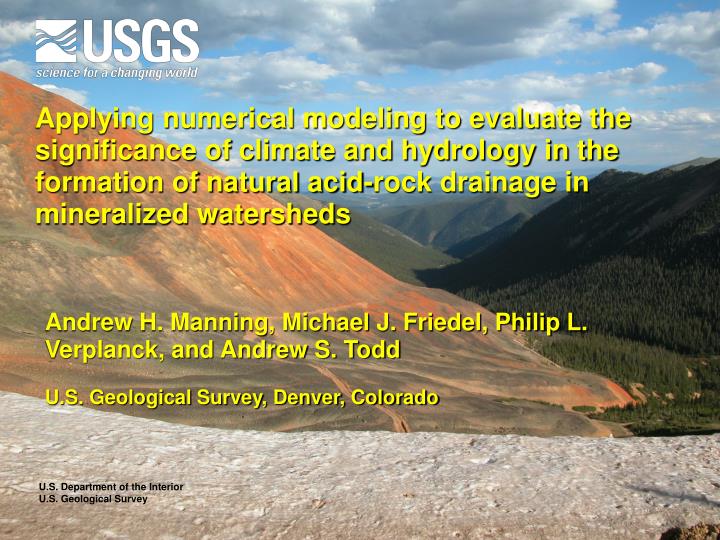
Applying numerical modeling to evaluate the significance of climate and hydrology in the formation of natural acid-rock drainage in mineralized watersheds. Andrew H. Manning, Michael J. Friedel, Philip L. Verplanck, and Andrew S. Todd U.S. Geological Survey, Denver, Colorado.

E N D
Applying numerical modeling to evaluate the significance of climate and hydrology in the formation of natural acid-rock drainage in mineralized watersheds Andrew H. Manning, Michael J. Friedel, Philip L. Verplanck, and Andrew S. ToddU.S. Geological Survey, Denver, Colorado U.S. Department of the Interior U.S. Geological Survey
Motivation for Study • Better understand processes controlling generation of natural acid-rock drainage (ARD) • Important for establishing pre-mining baseline conditions in mined locations and understanding acid weathering in general • Mineralogical factors have been studied extensively, but not climatologic and hydrologic factors • Support USGS Mineral Environmental Assessment Project • Which data types are most important to have in order to predict the natural quality of water in a given mineralized watershed? • Assess potential impact of climate change on water quality in mineralized watersheds • Might baseline conditions be a moving target?
Controls on Pyrite Oxidation FeS2 + 3.5O2 + H2O Fe2+ + 2SO42- + 2H+ Rate expression: (from Williamson and Rimstidt, 1994) • Where: • t = time [s] • k =rate constant [mol/m2/s] • k25= rate constant at 25oC [mol/m2/s] • Ea= activation energy • R = gas constant • T= absolute temperature A = surface area of pyrite [m2] A = VTVpyrpyAs where: VT= total volume of reaction vessel [m3] Vpy = volume fraction of pyrite rpy = density of pyrite [kg/m3] As= specific surface area [m2/kg] mO2=molality of oxygen [mol/L] mH+=molality of hydrogen ion [mol/L]
Climatologic and Hydrologic Controlling Factors Elevation • O2 partial pressure (air O2 concentration) • Dissolved O2 concentration Temperature • Reaction rate (k) • Dissolved O2 concentration Recharge Rate • Dilution • Dissolved O2 delivery Ground Surface O2 Diffusion Water Table Depth • Volume of pyrite available (A) • Deeper UZ’s may be anoxic Unsaturated Zone (UZ) Porosity • O2 diffusion rate Water Table Water Table Fluctuation Saturated Zone • Advective O2 gas transport (potential air pump)
Approach • TOUGHREACT code used to simulate natural pyrite oxidation • Developed by Xu et al. (1997) at Lawrence Berkeley National Lab • Finite difference code that simulates reactive chemistry, saturated/unsaturated groundwater flow, solute transport, and gas transport in UZ • Established ranges of variability for input parameters and built base-case model using mid-range/typical parameter values • Performed three types of sensitivity studies using base-case model in which input parameters were varied and changes in modeled concentrations were observed • Type 1: Manually varied input parameters by fixed percentage of base case value • Type 2: Automated version of above using inverse code PEST (Doherty, 2003) • Type 3: Manually varied input parameters by percentage of range of variability
TOUGHREACT Model Set-Up • Fractured rock represented by an equivalent porous medium • 1m x 1m x 40m column • 400 cells, each 0.1m thick • Recharge = dilute precipitation with pH = 6 • Top cell connected to atmosphere • Dissolved O2 in equilibrium with air throughout UZ • Initial water = precipitation and model run until quasi-steady-state conditions achieved (constant concentration profiles) recharge specified recharge rate in top cell z = 40 m at land surface O2 diffusion UZ Water Table z = 20 m (base case) Sat. Zone constant pressure in bottom cell to control WT depth z = 0 m discharge
Base Case Model Outputs pH Sulfate (mol/L) Liquid Saturation Dissolved O2 (mol/L) 0.0e-4 1.0e-4 2.0e-4 3.0e-4 4.0e-3 2.0e-3 0.0e-3 Depth (m) Depth (m) Depth (m) Depth (m) WT
Results of Type 1 and 2 Sensitivity Analysis • For manual test, parameters were varied 10% of base-case value • Sulfate concentration measure of degree of pyrite oxidation Sulfate Concentration climatologic/ hydrologic mineralogic PEST-Computed Sensitivity
Results of Type 3 Manual Sensitivity Analysis Sulfate – All Parameters • Parameters were varied by 10% of range of variability climatologic/ hydrologic mineralogic Sulfate – Measurable Parameters climatologic/ hydrologic mineralogic
Water Table Depth Considerations • What about deeper water tables? • At what depth do water tables typically become anoxic? Model for Well WP1 at Handcart Gulch Site Sensitivity Difference with DTW = 100m Base Case with DTW = 100 m • Vpy = 0.02 • k25 = 5e-9 mol/m^2/s • A = 3 cm^2/g • porosity = 0.01 • Elevation = 3800 masl • T = 2 degrees C • WT depth = 100 - 150 m • Recharge = 0.3 m/yr Observed range for water at water table • Well WP1 located on Continental Divide at 3700 masl • Site well characterized • Modeled sulfate concentration at water table = 114 mg/L • Observed sulfate concentrations at water table = 80 to 160 mg/L Water Table Water Table
Water Table Fluctuation Slug Recharge End Member Model rech. 2.0 m/yr Ground Surface SS Case for Recharge of 0.1 my = 0.3 mol/yr All recharge occurs instantaneously once each year % Seasonally Saturated Zone (%SSZ) = SSZ/TUZ Oxygen enters UZ by diffusion and by advection in air that replaces draining water rech. 1.0 m/yr Water table falls at constant rate all year Seasonally Saturated Zone (SSZ) rech. 0.2 m/yr Elevation rech. 0.1 m/yr rech. 0.02 m/yr rech. 0.01 m/yr Total UZ Depth (TUZ) Water Level Time
Predictions Based on Modeling Results • If climatic factors are as important as mineralogic factors, then: • Similar mineral assemblages (lithology and hydrothermal alteration types) exposed in different climates should produce different water chemistry • Attempting to test by assembling database of background water chemistry data from mineralized watersheds in a variety of climates • Significant changes in climate affecting a mineralized watershed should result in associated changes in water chemistry • Current climate change provides opportunity to test • Example: Rocky Mountains of Colorado. Since the 1980’s: • Mean annual air temperature increase of 1-2o • Decrease in winter precipitation • Earlier and more rapid snowmelt runoff ] Less recharge?
Average September Flow: Snake River at Montezuma 100 Average September Dissolved Sulfate and Zn at SW-044: (Snake River Above Deer Creek) 90 1980’s Mean = 44.8 1800 160 80 1990’s Mean = 40.4 140 1500 70 R2 = 0.82 2000’s Mean = 35.0 120 60 1200 Sulfate 100 Average Zn (ppb) Average monthly flow (cfs) 50 Average Sulfate (ppm) 900 80 40 60 600 Zn 30 40 R2 = 0.079 300 20 20 10 0 0 1975 1980 1985 1990 1995 2000 2005 2010 2015 0 Year 1975 1980 1985 1990 1995 2000 2005 2010 2015 Year Stream Water Data from Upper Snake River, Colorado • Small alpine watershed containing hydrothermal alteration • Base flow has dropped by about 20% • Chemistry data from Boyer et al. (1999), CO Dept. of Public Health and Environment, and Andrew Todd • Sulfate and zinc concentrations in base flow have increased 100-200% • Can rule out anthropogenic causes – area above sample point unmined • Can’t be dilution alone! R2 = 0.83
Lake Water Data from San Juan Mtns., Colorado • Lake chemistry data from Mast et al. (in press, Biogeochemistry) • Wimenuche Wilderness lakes in watersheds with hydrothermal alteration • Sulfate has increased 100-200%
Conclusions • Sensitivity studies suggest climatic/hydrologic factors are of similar importance to mineralogic factors in natural sulfide oxidation and ARD production • Water table depth, water table fluctuations, recharge rate, and temperature apparently most important climatic/hydrologic factors • Attempts to make even very general predictions regarding metal concentrations in mineralized watersheds likely would require climatic/hydrologic information in addition to mineralogic information • Water quality in mineralized watersheds could degrade significantly further as a result of predicted climate changes in coming decades