Download
1 / 25
250 likes | 266 Views
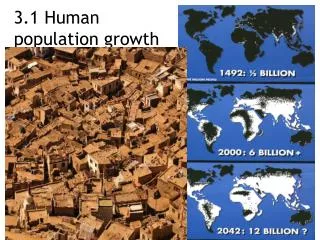
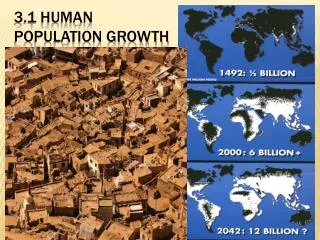
3.4.1 Human Population Growth. L.O: to describe and explain the shape of the human population growth curve to explain why different countries have different growth curves. Make a note of the total human population size, as we shall see how much it increases during the lesson!.

E N D
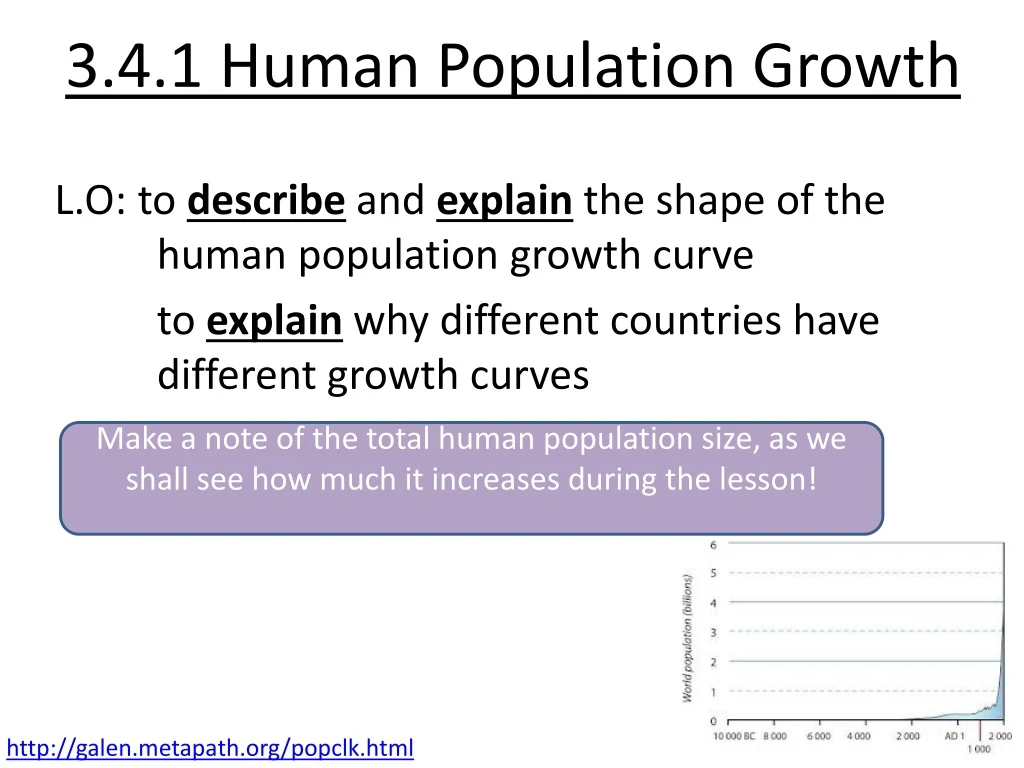
3.4.1 Human Population Growth L.O: to describe and explain the shape of the human population growth curve to explain why different countries have different growth curves Make a note of the total human population size, as we shall see how much it increases during the lesson! http://galen.metapath.org/popclk.html
http://www.youtube.com/watch?v=sc4HxPxNrZ0&feature=relmfu • http://www.bbc.co.uk/news/world-15445092
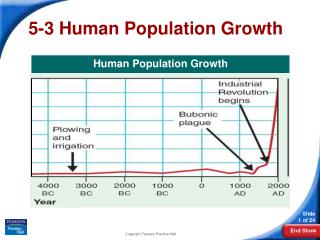
The human population There are currently more than 6 billion people on Earth. The human population has grown exponentially since the industrial revolution when new technology increased the carrying capacity of the Earth. population (billions) The population growth rate can be calculated by subtracting death rate from birth rate, or using the following equation: population at end of period population at start of period – population growth rate × = 100 population at start of period
Demography Demography is the study of the size and structure of populations, including a population’s age and sex distribution. Demographic rates, such aspopulation growth rate, birth rate and death rate can be used to describe how a population, or a subset of a population, changes over time. deaths births population immigration emigration A population’s demographic rates are determined by the environmental conditions. Human populations are greatly affected by their level of economic development.
Population growth rates • For each of the locations, calculate: • Birth rate • Death rate • Population growth • Population growth rate • What factors affect: a) birth rate? b) death rate?
Demographic Transition Model • Complete the sheet to show the name of each stage and the causes and effects on changes in birth/death rate and natural increase. • Try to suggest countries that may be in each stage.
Summary – Factors affecting human population size • Food availability – agricultural developments • Disease – healthcare, vaccinations, sanitation • New technologies/manufacturing techniques • War/natural disasters • Birth control/education • Economic conditions • Cultural/religious/political factors
Age population pyramids Show % male and female per age group Three typical types: • Stable population: birth rate = death rate • Increasing population: birth rate > death rate • Decreasing population: birth rate < death rate
Population Pyramids In pairs, use the data to draw one of the two pyramids each. You will need to calculate the %s first! Compare the shapes of the two pyramids – what do they tell you about the populations?
Survival curves and life expectancy Survival curves measure the life spans of a sample of individuals. At each age the number of survivors is plotted. developing 100 developed stone age survivors (%) 50 In general, more developed countries tend to have higher survival rates. This causes their curves to sit further to the right. 0 0 50 100 age (years) Survival curves can also be used to determine average life expectancy. This is the age at which 50% of the sample population is still alive.
Survival Curves Try the exam question…
Definitions Age population pyramid Birth rate Death rate Demographic transition Emigration rate Growth curve Immigration rate Life expectancy Population Population growth rate Survival curve