Download

1 / 32
320 likes | 329 Views
This study analyzes the spatial and temporal distribution of Precipitable Water Vapor (PWV) in the Balkans region using Global Positioning System (GPS), METEOSAT-8, and NCEP data sources. The aim is to aid in the analysis of weather and synoptic processes for the region.

E N D
Department of Materials and Environmental Engineering GEOPHYSICAL OBSERVATORY University of Modena and Reggio Emilia Via Vignolese 905, 41100 Modena, Italy GPS, NCEP DATA AND METEOSAT PRECIPITABLE WATER COMPARISONS FOR BALKANS AREA Boccolari M., Fazlagic S., Barbati A., Malmusi S., Santangelo R. [ boccolari.mauro@unimore.it / fazlagic.slobodan @unimore.it ] [fax (+) 39 059 2056243 ]
THE AIM OF THE WORK • PRECIPITABLE WATER VAPOR (PWV) studies has an important role for the hydrological regime evaluation with respect to the vertical structure of the atmosphere. • The aim of this work is to analyze different PWV observation systems: • - Global Positioning System (GPS)and • - meteorological satellites (METEOSAT-8) • together to • - global meteorologicaldata sources (NCEP) • in order to study PWV spatial and temporal distribution for Balkans region, sparsely covered with atmospheric vertical observations, as the helpful aid in the analysis of weather and synoptic processes for that region. DIMA Modena 2006
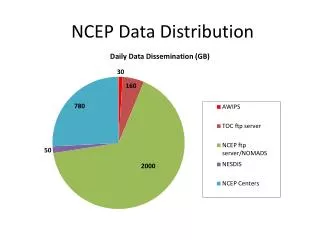
GPS, MSG, NCEP • GPS: Global Positioning System represents an enormous ongoing three-dimensional atmospheric observation system since the wet component of the tropospheric delay in GPS signals is nearly proportional to the quantity of integrated precipitable water vapor. • MSG: Tropospheric humidity product derived from the two water vapor channels of meteorological satellite METEOSAT-8 provides a layer-mean relative humidity for two tropospheric layers (between 850 and 600 hPa and between 600 and 300 hPa) with the resolution of 3 km; subsequently a biased estimation of PWV for the layer between 850 and 300 hPa can be obtained. • NCEP: Daily global analysis precipitable water data (since 1980) available at 2.5 degrees resolution from the National Centres for Environmental Prediction (NOAA-CIRES, Boulder, Colorado) is a helpful climate data source to evaluate humidity observations. DIMA Modena 2006
BALKAN’S SITES USED FOR THE STUDY • GPS Precipitable water derived from the four EUREF Balkan’s GPS sites of: • - SARAJEVO • - OSJEK • - DUBROVNIK • - OHRID • (Feb.01 - Dec.31.2004) • are presented in comparison to - METEOSAT-8 (MSG) - NCEP precipitable water data. DIMA Modena 2006
GPS European Network DIMA Modena 2006
APPROXIMATE POSITIONS (ITRF) OF GPS SITES DIMA Modena 2006
Introduction (1) • An increase in water vapor enhances the greenhouse effect and gives rise to further warming. • On longer time scales, water vapor changes are thought to contribute to an important positive feedback mechanism for climate change. • Due to fact that water vapor is a greenhouse gas, enhanced water vapor results in further warming, thereby creating a positive feedback. • Thus an understanding of the mechanisms distributing precipitable water vapor (PWV) through the atmosphere and of water vapor's effects on atmospheric radiation and circulation is vital to estimating long-term changes in climate. DIMA Modena 2006
Introduction (2) • With global warming, an increase in the rate of evaporation must be matched by an increase in the rate of precipitation, likely in the costal zones. • Thus, the acceleration of the global hydrological cycle seems to lead to an increase in the frequency of extreme precipitation events, and also an increase in the proportion of precipitation falling in the same extreme events. • Since the Mediterranean basin has a greater seasonal temperature change and plenty of the coastal area, thus brings the greater variability in the atmospheric water vapor for this region. DIMA Modena 2006
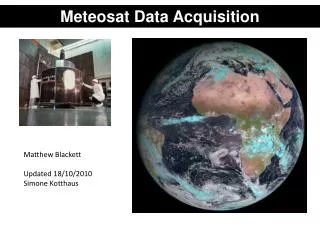
METEOSAT The most recent atmospheric water vapor observation technique is the satellite technology developed for the • METEOSAT SECOND GENERATION (MSG) active from August 2002 (operational from February 2004), where two of twelve monitoring channels are devoted to the water vapor (WV) bands observations. EUMETSAT(http://www.eumetsat.int) MSG Dataset: The mean daily relative humidity (in %) for channels (WV 6.2 and WV 7.3) or the upper tropospheric humidity (TH) as the mean layer relative humidity between 300 hPa and 850 hPa. DIMA Modena 2006
MSG DIMA Modena 2006
MSG • Spectral channel characteristics of • MSG SEVIRI • (Spinning Enhanced Visible and Infrared Imager)No Character λ(μm) 1 VIS0.6 0.635 Window 2 VIS0.8 0.81 Window 3 NIR1.6 1.64 Window 4 IR3.9 3.90 Window 5 WV6.2 6.25 Water vapor 6 WV7.3 7.35 Water vapor 7 IR8.7 8.70 Window 8 IR9.7 9.66 Ozone 9 IR10.8 10.80 Window10 IR12.0 12.00 Window11 IR13.4 13.40 Carbon dioxide12 HRV Broadband (about 0.4 – 1.1) Window/water vapor DIMA Modena 2006
MSG DIMA Modena 2006
GPS • The second important methodology comes from GPS (Global Positioning System) observation, where the column content of water vapor is obtained from the GPS electromagnetic signal’s non-hydrostatic tropospheric path delay. • GPS humidity observations have the advantage that they are economic and provide measurements which practically are not affected by rain and clouds; as well as GPS networks can estimate precipitable water to an accuracy of within 1-2 mm. • Since the infrared satellite techniques only work in the absence of significant cloud cover; radiosonde measurements are made mainly over the land and are widely spaced, the continuous GPS data may serve to complete the more accurate estimation of vertically integrated water vapor. DIMA Modena 2006
ELABORATION IN THIS WORK • Is made of 15-min satellite infra-red sampling and hourly processing between the homogenous and continuous MSG observations for the corresponding pixels in comparison to the sharply localized permanent Global Positioning System (GPS)integrated water vapor (IWV) observations. • Meteorological data on the surface level air pressure needed for the determination of the hydrostatic GPS signal delay (ZHD) are obtained from the climatological reanalysis via ftp from the site: ftp://www.cdc.noaa.gov/cdc/data.ncep.html • of NCEP (National Centers for the Environmental Prediction) Daily Global Analyses NOAA-CIRESClimate Diagnostics Center from Boulder, University of Colorado, which produces global meteorological data analysis. DIMA Modena 2006
Precipitable Water (PW) from GPS observations • GPS signals are delayed in the neutral atmosphere because of the refraction, as a function of temperature, pressure and water content. • Since the neutral atmosphere is mainly composed by dry air and water vapor,refractivity can be composed by a dry term and a wet term. • The wet part is to much variable in time and space. • For frequencies till 20 GHz refractivity can be written as a function of temperature and partial pressures: • [1] • where pdis the partial pressure of dry air (hPa) and e is the partial pressure of water vapor (hPa); k1,k2, k3are empirical constants (in K/hPa the first and the second, K/hPa2 the third);Zd-1and Zw-1 are the inverse compressibility for dry air and water vapor; Tis the air temperature (K). DIMA Modena 2006
Precipitable Water (PW) from GPS observations • The refractivity can be also split in • hydrostatic part Nhand • non hydrostatic part Nnh • The Zenith Hydrostatic Delay (ZHD) is the radio signal delay coming from zenith direction due to hydrostatic components of the atmosphere. • [2] • Applying the hydrostatic equation and based on Saastamoinen approximation the hydrostatic delay (in m) expression become: • [3] • p0is the surface pressure and f(f,h) is a lat/height depending function. DIMA Modena 2006
Precipitable Water (PW) from GPS observations • The Zenith Non Hydrostatic Delay (ZNHD) (often called Zenith Wet Delay – ZWD) is the zenithal radio signal delay due to non hydrostatic components of the atmosphere: • [4] From the expression for Nnh and after the definition of a vertical air column a water vapor mean temperature Tm, ZWD become: • [5] • ZWD is often expressed in terms of Precipitable Water Vapor (PWV) (or Integrated Precipitable Water Vapor) defined as: • [6] • where rv is the water vapor density and rw (=1000 kg/m3) is water density. DIMA Modena 2006
Precipitable Water (PW) from GPS Observations • Precipitabile water, PWV, is the water amount, expressed as height or mass, that could be had a column of the atmosphere with unitary cross-sectional section, were condensed and fallen (expressed in kgm-2 or millimeter of water). • A factor Q is depending by the vertical mean temperature Tm, • ZWD is proportional to PWV as: • [7] • Q is an adimensional quantity variable in space and time, however in mean is equal to 6.5. • The Zenith Total Delay (ZTD), is the sum of ZHD and ZWD: • [8] • Generally 10 mm PWV corresponds to approximately 65 mm of ZWD . DIMA Modena 2006
PRECIPITABLE WATER RESULTS • Tropospheric GPS solutions (ZTD) available by EUREF served to obtain daily average values. From eq. [8] ZWD is given as: ZTDminusZHD • ZHD is calculable by the surface air pressure in eq. [3] where f(f,l) was set up to one. • There are no meteorological measurements at Balkan’s GPS stations. For that purpose the surface level air pressure data are obtained from the NCEP climatological reanalysis via ftp from: ftp://www.cdc.noaa.gov/cdc/data.ncep.html referred to a 2.5°x2.5° resolution grid, needing to be interpolated spatially. • An additional vertical interpolation from the sea level was necessary also, to get data referred to the station altitude. • Using eq. [7] PWV data have been calculated. DIMA Modena 2006
PRECIPITABLE WATER from GPS DIMA Modena 2006
PRECIPITABLE WATER from NCEP • NCEP prepares a twice-daily global analysis at 2.5 degrees resolution on pressure levels as a product of the operational forecast system. • Spatial NCEP/NCAR coverage: 2.5-degree latitude x 2.5-degree longitude global grid 144x73 points 90N-90S, 0E-357.5E • After the NCEP/PWV extraction a spatial interpolation using the four grid data around each station was applied. • PWV values for the chosen sites are shown in the next Figure: DIMA Modena 2006
PRECIPITABLE WATER from NCEP DIMA Modena 2006
GPS/PWV and NCEP/PWV comparison • For all four Balkan stations the difference PWVGPS – PWVNCEP • is calculated on the mean daily basis in order to make their comparison: Table:Mean differences GPS – NCEP PWV and their standard deviations DIMA Modena 2006
PRECIPITABLE WATER from MSG • MSG products are derived as rectangular sub-areas of 32 x 32 infrared pixels. The MSG Tropospheric Humidity (TH) algorithm derives a relative humidity (in %). • The WV6.2 channel produces the mean layer relative humidity between 300 hPa and 600 hPa. • The WV7.3 channel produces the mean layer relative humidity between 600 hPa and 850 hPa. • Estimates of the relative humidity are made on a synoptic scale (i.e. 100 km or better). • MSG Products are checked and verified by comparing derived humidity with co-located radiosonde measurements. • The TH values are extracted 24 times a day. • For this work the hourly TH product was retrieved for the period from 1 February to 31 December 2004. DIMA Modena 2006
Obtaining PWV from TH product • The equation for precipitable water PWV as a function of the mixing ratio w is: • [9] • where dp is the pressure increment (Pa) and e (hPa) is the water vapor pressure, p is the total pressure (hPa). The gravity acceleration g is not constant, but since is varying with 0.001 mm for 20 mm PWV it has been considered as constant equal to 9.8 (m/s2). • The inferior layer (between the surface and the 850 hPa) and layers beyond the 300 hPa remain to be analyzed . • The contribution to the total precipitable water of advanced layers is negligible. Close to 99% of the water vapor content in atmosphere is found in the tropospheric layer, under the 300 hPa. • The water vapor pressure e is calculated from relative humidity r and saturated water pressure E: • [10] DIMA Modena 2006
Obtaining PWV from TH product • The saturated water vapor pressure E can be expressed in function of temperature T (in Celsius degrees) as: • [11] • Finally, the precipitable water is calculated combining the relative humidity data (TH MSG product) and temperature data (obtained from NCEP dataset). • Precipitable water from MSG TH product – algorithm: • the 24 hourly tropospheric humidity grid data for the two WV channels; • the air temperature for pressure levels (850, 700, 500, 400, 300 hPa); • the saturated water vapor pressure 3-d grid data E=E(i,j,l) is obtained; • the same resolution of MSG TH dataset is obtained; • for each grid point average values are calculated (for each channel); • for each pressure level the mixing ratio is calculated; DIMA Modena 2006
Obtaining PWV from TH product After the split layer’s precipitable water calculation for each grid point, PWV for the entire 850-300 hPa layer is calculated: Finally, the PWV spatial interpolation to the station ITRF position was done. DIMA Modena 2006
Precipitable water from TH product - results DIMA Modena 2006
PWVMSG and PWVGPS Comparison • The two precipitable water determination methods are compared in order to search the complementarities of two observing systems. • The differences and standard deviationsshow relatively homogeneous values and vary from station to station very slightly (except for Sarajevo’s very short series). DIMA Modena 2006
CONCLUSIONS • TOTAL PRECIPITABLE WATERobtained by GPS and MEDIUM LAYER PRECIPITABLE WATERby METEOSAT-8 for Balkans GPS sites: Sarajevo, Osjek, Dubrovnik and Ohrid (for 2004) are compared (with the help of NCEP data). • PWV GPS:The annual trend ofPWVGPScorrespond to an expected summer maximum and to the radiosondes equivalent limits. Mean annual values are similar (~ 20 mm) for all Balkan GPS sites and these value are in a good agreement with the NASA Water Vapor Project reports, as expected upon the many previous works. Standard deviations show generally good similar values. • PWV MSG:(for the 850 – 300 hPa layer) PWVMSGvalues seem rather high with respect to the climatological typical values, when tropospheric level with expected high relative humidity is omitted. Nevertheless, differences and standard deviations show relatively homogeneous values and vary from station to station very slightly indicating consistency of the MSG source and utility of this work. DIMA Modena 2006
CONCLUSIONS • Those very first considerations about Meteosat Precipitable Water indicate that some changes in the PWV algorithm are still needed, since the actual contributes from middle to high tropospheric levels seem overestimated with respect to the total vertical column. Actually, a special SAF CM is operational (from Sept. ’05) elaborating TOTAL PWV and layered PWV from the surface to 200 hPa. • The scarce coverage of almost all Balkan’s territory with valid GPS receivers diminishes our capability to provide detailed vertically profiled humidity data for the both synoptic and climatologic numerical models. Being the methodology of rather low cost the installation of such instruments should be strongly encouraged in the future. DIMA Modena 2006
PRECIPITABLE WATER from SAF CM(Satellite Application Facility on Climate Monitoring) DIMA Modena 2006