Download
1 / 41
410 likes | 535 Views
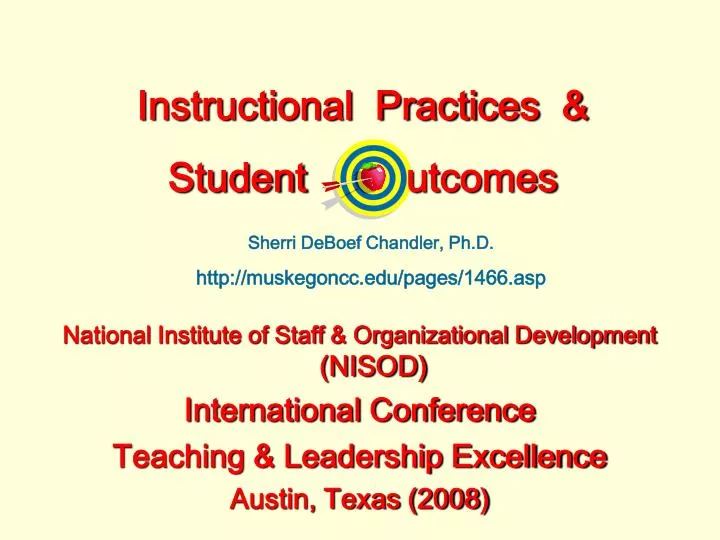
Instructional Practices & Student utcomes. National Institute of Staff & Organizational Development (NISOD) International Conference Teaching & Leadership Excellence Austin, Texas (2008). Sherri DeBoef Chandler, Ph.D. http://muskegoncc.edu/pages/1466.asp.

E N D
Instructional Practices &Studentutcomes National Institute of Staff & Organizational Development(NISOD) International Conference Teaching & Leadership Excellence Austin, Texas (2008) Sherri DeBoef Chandler, Ph.D. http://muskegoncc.edu/pages/1466.asp
Instructional Practices & Student utcomes The challenge is for faculty to ask: ✏ “Is what we are doing working? ✏ How do we know? ✏What changes do we need to make?” (Rouseff-Baker & Holm, 2004, pp. 30-41).
Student utcomes ✏ Attrition (D, F, W) (D grades do not transfer F grades become W grades when student successfully completes) ✏ Performance (A, B, C) ✏ Enrollment (pre and post drop/add)
potential instructional practices ✏Classroom goal structure (competitive vs. collaborative) ✏Explicit objectives with frequent accurate feedback (allowing students to regulate their learning) ✏Instruction aligned with performance assessment ✏ Multiple instructional and assessment modalities ✏Optimal challenge (work pace) ✏ Affective and social-relational dimensions
potential student variables Review of educational literature identified: ✏Student interest ✏Student effort ✏Student ability (ACT/SAT/ASSET) ✏Student sex (m or f) ✏Student socio-economic status (college aggregate information only)
study variables ✏ Student Status (sex & ability) Registrar Data ✏ Instructional Practices (grading & work pace) Syllabi Data ✏ Student Outcomes (performance & attrition) Registrar Data ✏ Institutional Outcomes (enrollment) Registrar Data
Table 1. Comparison of four instructional practice variables.
grading practices ✏criterion-referenced: based upon a predetermined point scale aligned with the achievement of competencies, also called standards-referenced or absolute; ✏norm-referenced: derived from ranking the performance of students in a course, also known as grading on the curve or relative grading. ✏course work pace (unchallenging, optimum, excessive)
lax excessive Figure 1. Work Pace Theory (based upon research conducted by Cashin, 1995; Elton, 2004; and Scriven 1995).
appropriate difficulty refers to amount & pace of course work ✏ excessive amount of course material w/ lack of opportunity to pursue subject in depth associated w/ poor student learning ✏ reported across educational psychology & cognitive psychology research using survey & experimental methods (Driscol, 2005; Prindle, Kennedy, & Rudolph, 2000; Rhem, 1995; Schunk, 2004; Theall, 1999; Upcraft et al., 2005)
Figure 2. Comparison of criterion-referenced group performance.
Figure 4. Comparison of instructional groups by Criterion and Norm-referenced Grading.
Table 2. Conversion Formula: Planning and Placement Test Codes Plan used by many community college counselors to determine student readiness for college level courses (U.S. Dept. of Ed., 2006). * (Prior to enrolling in college level course)
Figure 5. Student ability scores, course performance, and instructional group.
Student attrition (grades of D, F, W) ✏Few D’s in data set (n = 6%) D+, D, D- do not transfer, student not allowed to enroll in higher level course/ some programs of study unless C or ↑ ✏F does not transfer, affects G.P.A. negatively becomes W if student successfully completes ✏W does not transfer, no affect on G. P. A. may affect financial aid adversely (6.7% F’s & 11% W’s in data set)
per coursesyllabi Crit.-ref. Work pace 1: Does not give F, failing and no show student’s receive W. Norm-ref. Work pace 2: Students who attend and do not succeed receive F, gives W for poor attendance across the course. Crit.-ref. Work pace 3: Students who attend and do not succeed receive F. gives W for poor attendance (5) across the course. Norm-ref. Work pace 4: Does not give D, failing, poor attendance, no show receive F, gives W, does not specify circumstances/conditions.
drop & add ✏ student voluntary withdrawal within first 1.5 weeks or teacher may withdraw student,both entail full student refund ✏ student drop data not maintainedin registrar records ✏ analyzed courses w/ typically full enrollment (30 students per course for classes from 9 a.m. through 3 p.m., Monday through Thursday)
student performance ✏Instructors express confusion of standards and grading when they attribute high rates of student performance to either low course standards or easy grading practices, but not actual student learning. (Sojka, Gupta, & Deeter-Schmelz, 2002). ✏ When a student says a course is hard, it is not a compliment; indicates the teacher has not done a good job of teaching the that particular student. ✏Efficient and successful learning will NOT seem difficult. (Whiting,1994 p. 13).
attrition ✏Individual student withdrawal may result from personal circumstances. ✏ The rate of student related reasons for attrition tend to be consistently low across courses (Hartlep & Forsyth, 2000; McGrath & Braunstein, 1997;Moore, 1995). ✏The quality of instruction is a primary factor associated with high rates of attrition (Harrison, Ryan, & Moore. 1996; Mentkowski et al., 2003, Tinto, 1993).
methodology ✏Multiple measures: ⁃ syllabi data ⁃ registration data ⁃ student self-report ✏Two independent auditors: ⁃ of raw data ⁃ of statistical analysis ✏ Member checking ✏Data checks at each stage
Why MRC ? ✏Assumptions required to conduct multiple regression analyses include: ⁃ linearity; ⁃ independent observations; ⁃ similar variances for all groups; ⁃ a normally distributed sample with few if any outliers; ⁃ accuracy of measurement; ⁃ adequate sample size (Bordens & Abbott, 2005, pp. 427–431). ✏ Multiple regression correlation is robust concerning violation of the normal distribution requirement as long as variables are independent. ✏ Inspection of scatterplots and histograms indicated no violation of the required assumptions. (Morgan, Friego, & Gloeckner, 2001)
Table 3. Hierarchical logistic regression for attrition (N = 1,614). *p .05; **p < .001; *** SPSS automatically excluded value from the analysis. Block 1 (sex) Nagelkerke R ²= .006; Block 2 (ability) Nagelkerke R ²= .011; Block 3 (grading practice) Nagelkerke R ²= .011; Block 4 (work pace) Nagelkerke R ² = .126.
Table 4: Post hoc test for attrition by instructional group. (N = 1614). Tukey HSD. *p > .05; **p < .001; *** As noted in preceding rows.
findings The institutional data regarding instructional practices and student outcomes suggest ✏Attrition rates were associated with instructional practices (such as work pace and assessment opportunities) in courses with criterion-referenced grading practices with medium effect sizes (p .001). ✏The variables of student sex and student ability are NOT practical predictors either independently or interactively for student attrition outcomes.
aggregate data may alter the original characteristics of data ✏In this data set, combining courses in terms of norm or criterion-referenced grading practices obscured important patterns of student outcomes. ✏Examining the distribution of student outcomes by course and instructor may reveal more about instructional practices and student outcomes than the analyses of aggregate course and program data.
✏ Instructional practices (other than the variables identified) could account for the student outcome differences between the instructional groups within this sample. ✏Unidentified instructional & student characteristics may be stronger predictors of student attrition, enrollment, performance than course grading practices and work pace, but were not consistently available in the institutional records.
instructional practices ✏ accounted for 12% - 13% of the variation in student attrition, enrollment, performance (24 +% for criterion-referenced groups) ✏ leaving 87% to 88% of the variability in student outcomes unaccounted for in this study. (leaving 76% for criterion-referenced groups)
Instructional Practices &Student utcomes This study points to the necessity ✏ of identifying instructional practices of course work pace, assessments, and type of course grading methods ✏ and including these instructional practices as predictor variables for any meaningful assessment of student outcomes.
Appendix 1. Demographics of sample, institution, college population. * Anonymous Community College Impact Statement, 2005. ** Carnevale & Derochers, 2004b; National Center for Public Policy and Higher Education, 2006.
Appendix 2. * explanation for different totals ✏Population of four full-time instructors, across 5 years, 15 courses each (total 60 courses) With student drops and “retakes” present: N = 1820 ✏Student retakes are those students with D, F, W who “retake” the course, sometimes the same student 2-5 times. Each student maintained in the sample only the initial time in analyzed data. ✏Total sample of two instructors, across 3 years, 15 courses each With drops and retakes: N = 920 Without drops or retakes: N = 836 (no sex or ability scores available for student drops) Note: more students chose to retake the course in the X instructional group and were removed, further reducing the enrollment gap between the two groups.
references Abrami, P., & D’Appolonia, S. (1999). Current concerns are past concerns. American Psychologist, 54 (7) 519–20. ACT Institutional Data. (2002). (retrieved from: http://www.act.org/path/policy/pdf/retain_2002.pdf on 1/29/04.) ACT, Inc. (2004). Crisis at the core: Preparing all students for college and work. Iowa City, IA: Author. ACT, Inc. (2006). Reading between the lines: What the ACT reveals about college readiness In reading. Iowa City, IA: Author. Addison, W., Best, J. Warrington, H. (2006). Student’s perceptions of course difficulty and their ratings of the instructor. College Student Journal, 40(2). (Accessed 07/27/06.) Adelman, C. (1992). The way we were: The community college as American thermometer. Washington, DC: U.S. Government Printing Office. Alstete, J. W. (1995). Benchmarking in higher education: Adapting best practices to improve quality. ASHE-ERIC Higher Education Report no. 5. Washington DC: Office of Educational Research and Improvement. Andreoli-Mathie, V., Beins, B., Ludy, T. B., Wing, M., Henderson, B., McAdam, I., & Smith R. (2002) Promoting active learning in psychology courses. In T. McGovern, (Ed.) Handbook for enhancing undergraduate education in psychology. Washington, DC: American Psychological Association. Bain, K. (2004). What the best college teachers do. Cambridge, MA: Harvard University Press.
references Barefoot, B., & Gardner, N. (Ed.). (2005). Achieving and sustaining institutional excellence for the first year of college. San Francisco: Jossey-Bass. Barr, R. B. (1998, September/October). Obstacles to implementing the learning paradigm – What it takes to overcome them. About Campus. Bender, B., & Shuh, J. (Eds). (2002, Summer). Using benchmarking to inform practices in higher education. New Directions in Higher Education, 118, San Francisco: Jossey-Bass. Bers, T. H., & Calhoun, H. D. (2004, Spring). Literature on community colleges: An overview. New Directions for Community Colleges, 117, p. 5–12, Wiley Publications. Boggs, G. R. (1999). What the learning paradigm means for faculty. AAHE Bulletin, 51 (5). 3-5. Bordens, K., & Abbott, B. (2004). Research design and methods: A process approach, (6th ed.). Boston, MA: McGraw-Hill. Bracey, G. W. (2006). Reading educational research: How to avoid getting statistically snookered. Portsmouth: NH: Heinemann. Bryant, A. N. (2001). Community college students recent finings and trends. Community College Review, 29(3) 77-93. Burke, J. C., & Minassians, H. P. (2004, Summer). Implications of state performance indicators for community college assessment. New Directions For Community Colleges, 126, 53-64. Brookhart, S. M. (1994). Teachers’ grading: Practice and theory. Applied Measurement in Education, 7 (4).
references Connor-Greene, P. A. (2000). Assessing and promoting student learning: Blurring the line between teaching and testing. Teaching of Psychology, 27 (2). Costa, A. L., & Kallick, B. O. (Eds.). (1995). Assessment in the learning organization: Shifting the paradigm. Alexandria VA: Association for Supervision & Curriculum Development. Darling Hammond, L. (2000, January). Teacher quality and student achievement: A review of state policy evidence. Education Policy Analysis Archives, 8 (1). Davis, T. M., & Hillman Murrell, P. (1993). Turning teaching into learning: The role of student responsibility in the collegiate experience. ASHE-ERIC Higher Education Reports, Report 8. Washington, DC: The George Washington University. Kember, D. (2004). Interpreting student workload and the factors which shape students’ perceptions of their workload. Studies in Higher Education, 29(2) 165-184. Keppel, G. (1991). Design and analysis: A researcher's handbook. Englewood Cliffs, NJ: Prentice Hall. Keppel, G., Saufley, W. H. Jr., & Tokunaga, H. (1992). H. Introductionto design and analysis: A student’s handbook (2nd ed.). New York: W. H. Freeman and Company. Keppler, G. & Zedeck, S. (1989). Data analysis for research designs. Belmont, CA: Worth Publishers.Keppel, Saufley & Tokunaga, 1992; Levine, D., & Lezotte, L. (1990). Universally effective schools: A review and analysis of research and practice. Madison, WS: National Center.
references Lincoln, Y., & Guba, E. (1985). Naturalistic Inquiry. Beverly Hills, CA: Sage Publications. Marsh, H. (1998). Students’ evaluation of university teaching: Research findings, methodological issues, and directions for future research. International Journal of Educational Research, 11, 253-388. Marsh, H., & Roche, (2000, March). Effects of grading leniency and low workload on students’ evaluations of teaching: Popular myth, bias, validity, or innocent bystanders? Journal of Educational Psychology, 92 (1), 202-208. Marzano, R.J., Pickering, D. J., & Pollack, J. E. 2001). Classroom instruction that works: Research based strategies for increasing student achievement. Alexandria, VA: McRel Institute. McClenney, K. M. (2006. Summer). Benchmarking effective educational practice. New Directions for Community Colleges, 134, 47-55. McKeachie, W. (2002). McKeachie's teaching tips: Strategies, research, and theory for college and university teachers (11th ed.). New York: Houghton Mifflin. McMillan, J. H. (Ed.). (1998). Assessing students' learning. San Francisco: Jossey-Bass. McMillan, & Wergin (2007). Understanding and evaluating educational research, (3rd ed.) Upper Saddle River: N.J.: Pearson. Morgan, G., Gliner, J., & Harmon, R. (2001). Understanding research methods and statistics: A practitioner’s guide for evaluating research. Mahwah, NJ: Lawrence Erlbaum Associates
references Stiggins, R. J. (2005). Student-involved assessment for learning, 4th ed. Upper Saddle River, NJ: Pearson & Prentice Hall Publishers. O’Banion, T. (1997). Creating more learning-centered community colleges. League for Innovation in the Community College. (ERIC report downloaded 07/12/06). Pascarella, E. T., & Terenzini, P. T. (2005). How College Affects Students: Vol. 2, A third decade of research. San Francisco: Jossey-Bass. Popham, W. J. (2005). Classroom assessment: What teachers need to know, 4th ed. Boston, MA: Allyn & Bacon Publishers. Ratcliff, J. L., Grace, J. D., Kehoe, J., & Terenzini, P. and Associates. (1996). Realizing the potential: Improving postsecondary teaching, learning, and assessment. Office of Educational Researcher and Improvement. Washington, DC: U. S. Government Printing Office. Rinaldo, V. (2005, October/November). Today’s practitioner is both qualitative and quantitative researcher. The High School Journal, 89. The University of North Carolina Press. Rouseff-Baker, F., & Holm, A. (2004, Summer). Engaging faculty and students in classroom assessment of learning. New Directions For Community Colleges, 126, 29-42. Serban, A. (2004, summer). Assessment of student learning outcomes at the institutional level. New Directions for Community Colleges, 126. Wiley Periodicals
references Scriven, M. (1995). Student ratings offer useful interpretation to teacher evaluation. Practical Assessment, Research & Evaluation, 4 (7). http://aera.net/pare/ getvn.asp/ Seiler, V., & Seiler, M. (2002, Spring). Professors who make the grade. Review of Business, 23(2), 39. Tagg, J. (2003). The learning paradigm college. Williston, VT: Anker Publishing Company, Incorporated. Tinto, V. (1993). Leaving college: Rethinking the causes and cures of student attrition (2nd ed.). Chicago: University of Chicago Press. Townsend, B. K., & Dougherty, K. J. (2006, Winter). Community college missions in the 21st century. New Directions for Community Colleges, 136. Upcraft, M. L., Gardener, J., Barefoot, B., & Associates. (2005). Challenging and supporting the first year student. San Francisco: Jossey-Bass. Valsa,K. (2005). Action research for improving practices: A practical guide. Thousand Oaks, CA: Paul Chapman Publishing. Walvoord, B. E. & Johnson Anderson, V. (1998). Effective grading: A tool for learning and assessment. San Francisco: Jossey-Bass. Walvoord, B. E. (2004). Assessment clear and simple: A practical guide for institutions, departments, and general education. San Francisco: Jossey-Bass. Wiggins, G. (1998). Educative assessment: Designing assessments to inform and improve student performance. San Francisco: Jossey-Bass.