Download
1 / 25
250 likes | 412 Views
Evaluation: Controlled Experiments. Chris North cs3724: HCI. Presentations. dan constantin, grant underwood, mike gordon Vote: UI Hall of Fame/Shame?. Next. Apr 4: Proj 2, final implementation Presentations: UI critique or HW2 results Thurs: matt ketner, sam altman

E N D
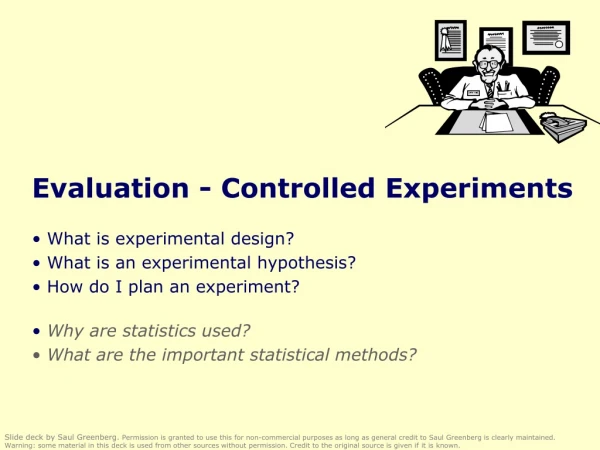
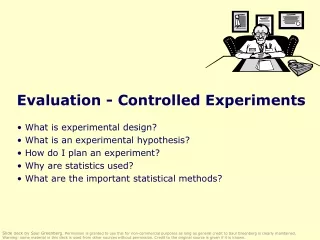
Evaluation:Controlled Experiments Chris North cs3724: HCI
Presentations • dan constantin, • grant underwood, • mike gordon • Vote: UI Hall of Fame/Shame?
Next • Apr 4: Proj 2, final implementation Presentations: UI critique or HW2 results • Thurs: matt ketner, sam altman • Next Tues: karen molye, steve kovalak • Next Thurs:
Review • 3 approaches for navigating large information spaces? • detail only • Zoom • Overview+detail • Focus+context
Review: Visualizing Trees • 2 approaches: • Connection • Containment • Hyperbolic: • 100s nodes + structure • TreeMap: • 1000s nodes + attributes • 3D: infovis design is critical, not just VRML
Process Design Evaluate Develop Continuous iteration
UI Evaluation • Early evaluation: • Wizard of Oz • Role playing and scenarios • Mid evaluation: • Expert reviews • Heuristic evaluation • Usability testing • Controlled Experiments • Late evaluation: • Data logging • Online surveys
Controlled Experiments • Scientific experiment with real users • Typical HCI goal: which UI is better?
What is Science? • Measurement • Modeling
Scientific Method • Form Hypothesis • Collect data • Analyze • Accept/reject hypothesis
Deep Questions • Is ‘computer science’ science? • How can you “prove” a hypothesis with science?
Empirical Experiment • Typical question: • Which UI is better in which situations? Lifelines PerspectiveWall (zooming) (focus+context)
More Rigorous Question • Does UI (Lifelines or PerspWall) have an effect on user performance time for task X for suchnsuch users? • Null hypothesis: • No effect • Lifelines = PerspWall • Want to disprove, provide counter-example, show an effect
Variables • Independent Variables (what you vary) and treatments (the variable values): • User Interface • Lifelines, Perspective Wall, Text UI • Task type • Find, count, pattern, compare • Data size (# of items) • 100, 1000, 1000000 • Dependent Variables (what you measure) • User performance time • Errors • Subjective satisfaction (survey), retention, learning time • HCI metrics
Example: 2 x 3 design Ind Var 2: Task Type • n users per cell Ind Var 1: UI Measured user performance times (dep var)
Groups • “Between subjects” variable • 1 group of users for each variable treatment • Group 1: 20 users, Lifelines • Group 2: 20 users, PerspWall • Total: 40 users, 20 per cell • “With-in subjects” (repeated) variable • All users perform all treatments • Counter-balancing order effect • Group 1: 20 users, Lifelines then PerspWall • Group 2: 20 users, PerspWall then Lifelines • Total: 40 users, 40 per cell
Issues • Fairness • Randomized • Identical procedures • Bias • User privacy, data security • Legal permissions
Procedure • For each user: • Sign legal forms • Pre-Survey: demographics • Instructions • Do not reveal true purpose of experiment • Training runs • Actual runs • Post-Survey: subjective measures • * n users
Data • Measured dependent variables • Spreadsheet • Lifelines task 1, 2, 3, PerspWall task 1, 2, 3
Averages Ind Var 2: Task Type Ind Var 1: UI Measured user performance times (dep var)
PerspWall better than Lifelines? • Problem with Averages: lossy • Compares only 2 numbers • What about the 40 data values? (Show me the data!) Avg Task1 perf time (secs) Lifelines PerspWall
The real picture • Need stats that take all data into account Perf time (secs) Lifelines PerspWall
Statistics • t-test • Compares 1 dep var on 2 treatments of 1 ind var (2 cells) • ANOVA: Analysis of Variance • Compares 1 dep var on n treatments of m ind vars (n x m cells) • Result: “significant difference” between treatments? • p = significance level (confidence) • typical cut-off: p < 0.05
p < 0.05 • Woohoo! • Found a “statistically significant difference” • Averages indicate which is ‘better’ • Conclusion: • UI has an “effect” on user performance for task1 • PerspWall better user performance than Lifelines for task1 • “95% confident that PerspWall better than Lifelines” • Not “PerspWall beats Lifelines 95% of time” • Found a counter-example to the null-hypothesis • Null-hypothesis: Lifelines = PerspWall • Hence: Lifelines PerspWall
p > 0.05 • Hence, same? • UI has no effect on user performance for task1? • Lifelines = PerspWall ? • NOT! • We did not detect a difference, but could still be different • Did not find a counter-example to null hypothesis • Provides evidence for Lifelines = PerspWall, but not proof • Boring! Basically found nothing • How? • Not enough users • Need better tasks, data, …