Download
1 / 27
270 likes | 407 Views
Energy. World energy consumption projected to rise > 70% from 2003 to 2030 OECD. Energy. Bulk of increase expected to come from non-OECD nations Energy demand in Asia, Central and South America expected to more than double by 2030. Energy Conventional Fossil Fuels Oil

E N D
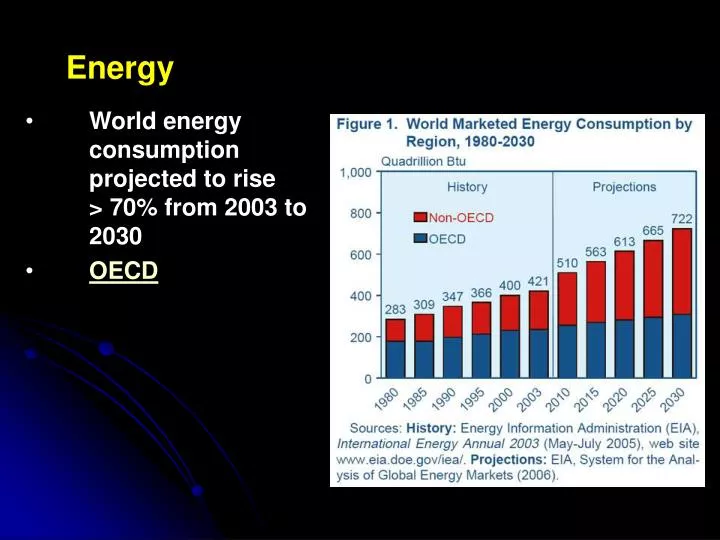
Energy • World energy consumption projected to rise > 70% from 2003 to 2030 • OECD
Energy • Bulk of increase expected to come from non-OECD nations • Energy demand in Asia, Central and South America expected to more than double by 2030
Energy • Conventional • Fossil Fuels • Oil • Transportation, electricity generation, heating • World’s dominant source of energy for past several decades • Expected to remain important for next 20 years - Estimated ~35-40% of total energy consumption through 2020 • Greatest consumption by OECD nations, but gap closing • 1999 – Non-OECD nations consumed 58% as much as OECD nations • 2030 – Projected to use ~90% as much • Most of increase from transportation sector (few alternative fuel sources)
Energy • Conventional • Fossil Fuels • Oil • Benefits • Readily available • High energy density • Inexpensive • Existing technology & infrastructure • Concerns • Combustion releases pollutants (CO2, NOx, SOx, PM) • Extraction harms environment • Accidental releases, especially in ocean • Long-term availability • Energy security - US imports 60% of oil
Energy • Conventional • Fossil Fuels • Coal • Electricity generation (65% of global coal use) • Main fuel source in China for industry • Use expected to grow slowly, mostly fueled by Asia, especially China and India • Benefits • Inexpensive • Abundant, easy to recover • Requires minimal processing • Existing technology & infrastructure • Concerns • Environmental degradation from mining • Requires extensive transportation system (rail) • Combustion generates pollutants (CO2, PM, Hg, NOx, SOx), including components of brown smog
Energy • Conventional • Fossil Fuels • Natural gas (methane) • Fastest growing source of energy over next 20 years (projected to double) • Equaled coal (BTU basis) in 1999 • Increase fueled by price, environmental concerns, energy security issues, market deregulation • Benefits • Inexpensive • Abundant, easy to recover • Existing technology & infrastructure • Burns relatively cleanly (little PM, etc.), almost no solid waste • High efficiency (90% vs. 27% for electricity) • Energy security – US produces 85% of demand vs. 40% for oil • Concerns • Greenhouse gas • Adequate long-term supply
Energy • Conventional • Fossil Fuels • Gas (methane) hydrates • Worldwide reserves estimated at up to 100,000 trillion cubic feet of gas (10,000 Gt carbon), twice the carbon in all other fossil fuel reserves on earth • Located beneath marine sediments at 300-500 m depth • Common off SE US, Siberia, Alaska • Benefits • Extremely abundant • Existing infrastructure for distribution • Burns relatively cleanly (little PM, etc.), almost no solid waste • High efficiency (90% vs. 27% for electricity) • Energy security – US has extensive reserves • Concerns • Greenhouse gas • Damage to sea floor • Catastrophic effects of massive release
Energy • Conventional • Nuclear • Derived from splitting ("fissioning“) of uranium atoms • Uranium mined, processed to increase fissionable material, made into fuel rods • Uranium atoms split inside reactor, generate heat steam electricity • World capacity projected to rise from 362 GW in 2003 to 437 GW in 2030 • Highest growth projected for developing world, especially Asia • Benefits • Clean (few pollutants or GHGs) • Relatively inexpensive • Existing technology & infrastructure • Compact fuel & waste (high energy density – 1 lb of U = 3.5 million lbs of coal) • Energy security – US has extensive reserves • Concerns • Safety – Possibility of accidents • Strategic risks – Material stolen and used to create weapon • Waste disposal – Contamination of ground water, soil, animals, plants, people • GHG production from mining & transportation of uranium
Energy • Renewable • Sources either can’t be used up or are replenished quickly through natural processes • In CA, eligible renewable energy sources include • Biomass and waste • Geothermal • Solar • Small hydroelectric • Wind energy • Use expected to increase by 65% worldwide between 2003 and 2030; current 8% share of total energy consumption projected to rise slightly to 9% by 2030 • Growth in renewable energy resources expected to be constrained by moderate fossil fuel prices • Energy consumption expected to be driven by new, large-scale hydroelectric projects, esp. in China, India, Malaysia, other developing Asian countries
Energy • Renewable • Hydroelectric • Currently supplies ~20% of electricity production worldwide • Small (<30 MW) • Less impact but less power than large facilities • Large (>30 MW) • Includes immense dams with potentially large impacts • Ex – Itaipu Dam (Brazil, Paraguay, Argentina) = 12,600 MW • Ex – Three Gorges Dam (China) = 18,200 MW • Benefits • Inexpensive, once facility exists • Minimal environmental impact – Little pollution, no GHGs • Many facilities already in place • May permit flood control • Relatively efficient and nondestructive • Concerns • Limited use geographically • Environmental degradation in flooded areas • Environmental degradation downstream • Detrimental to some aquatic animals (Ex – salmon) • Collapses can be catastrophic • Rainfall variation can reduce reliability
Energy • Renewable • Wind • Power captured with wind turbines • The Dakotas and Texas have sufficient wind capacity to supply energy needs of entire United States • Benefits • “Free” • Minimal environmental impact – Little pollution, no GHGs • Can produce electricity without being connected to power grid • Multiple uses of land • Concerns • Limited use geographically • Inconsistent energy source • Expensive to maintain • May be dangerous to birds • Low power density • Weather effects?
Energy • Renewable • Solar • Can be generated by • Focusing heat of sun on central point that heats up; heat used to produce steam, which turns turbine • Photovoltaic (PV) cells – Convert energy from sun directly to electricity; each PV panel typically produces small amount of electricity, but panels can be grouped • Benefits • Abundant – “The amount of solar radiation striking the earth over a three-day period is equivalent to the energy stored in all fossil energy sources.” • “Free” • Minimal environmental impact – Little pollution, no GHGs • PV systems have no moving parts, require little maintenance • Can produce electricity without being connected to power grid • Concerns • Limited use geographically • Inconsistent energy source • Expensive – $0.22-0.40/kWh vs. $0.13/kWh on my latest bill • Requires special materials to harvest energy • Low power density; long-term storage of energy
Energy • Renewable • Biomass and Waste • Biomass fuels include residues from logging; mill operations; processing of wood, pulp, paper, fiberboard; agricultural crops; livestock and poultry operations; food processing; demolition (urban wood waste) • Waste fuels include combustible residues from industrial processes, municipal solid & liquid wastes • Currently supplies ~15% of electricity production worldwide, more in developing countries • Benefits • Readily available fuel • Inexpensive • Reduces waste stream • Concerns • Emissions – Especially for waste combustion • Low fuel density • Technology not yet well developed
Energy • Renewable • Geothermal • Heat from deep within earth captured and used to turn an electric generation turbine • Benefits • Inexpensive • Minimal environmental impact – Little pollution, no GHGs • Energy security – US has extensive resources • Concerns • Limited use geographically • Not truly renewable (water injection can prolong life of geyser field) • Geothermal emissions may include CO2 and H2S, as well as various toxic compounds • Not economically viable in most areas
Energy • Renewable • Fuel Cells • Many types • All have membrane that only allows positively charged particles to cross and external shunt that channels electrons • Have been used for decades (powered manned space flights) • Benefits • Low emissions • Highly efficient (up to 85% in some cases) • No moving parts – Enhances durability, simplifies maintenance • Energy security – Can be produced anywhere • Concerns • Technology still in its infancy • Energy input during processing • Risks of handling hydrogen and other fuels • Currently very expensive
Energy • Renewable • Other • Tidal energy • Wave energy • OTEC (Ocean Thermal Energy Conversion) • Fusion
Energy California Net System Power Mix
Fresh Water • Historically limiting factor in arid regions • 1940-1990 • World population more than doubled • 2.3 billion 5.3 billion • Per capita water use doubled • 400 m3 person-1 year-1 800 m3 person-1 year-1 • Global water use increased fourfold • Current Status • In 1996, world human population using estimated 54% of all accessible fresh water in rivers, lakes, aquifers • Many people predict disastrous consequences for world’s fresh water supply in coming years • This potential disaster may have several causes
Fresh Water • Current Status • Distribution • Uneven compared to population • 75% of annual rainfall in areas containing less than one-third of global population • Amazon River carries 20% of global runoff through area containing 10 million people • Congo River carries 30% of Africa’s runoff through area containing 10% of population • Uneven in space • North America contains 19,000 m3 per person per year vs. 4700 m3 per person per year in Asia • <10% of Mexico supplies >50% of annual runoff • Uneven in time • India gets 90% of annual rainfall during summer monsoon season (Jun-Sep); runs off too rapidly for efficient use
Fresh Water • Current Status • Usage patterns • Agriculture – 69% • Industry/Energy – 23% • Domestic – 8% • Varies among regions and with development • Africa – 88% for agriculture (irrigation) • Europe – >50% for industry • Japan – Industrial but uses lots of water for growing rice • Spain/Portugal – Arid; water used heavily for agriculture • Personal use tracks standard of living • Africa – 17 m3 year-1 (47 l d-1) • Asia – 31 m3 year-1 (85 l d-1) • UK – 122 m3 year-1 (334 l d-1) • US – 211 m3 year-1 (578 l d-1) • By 2020, water shortages likely in Ethiopia, India, Kenya, Nigeria, China (parts of China already face problems) • Mexico City uses groundwater for 80% of municipal water supply • Depletion exceeds aquifer recharge rate by 50-80% • Sinking of land in some areas Damage to buildings • City imports water to meet demand
Fresh Water • Current Status • Contamination • Numerous examples worldwide • Biggest source = Agriculture • Europe – Over 90% of rivers have elevated nutrient levels from agrochemicals • Hungary – Nearly 40% of well fields contaminated • Developing countries – On average, 90% to 95% of all domestic sewage and 75% of all industrial waste discharged into surface waters without treatment • Impacts • Nile River – Diverting water + retention of sediment behind dams has caused fertile delta to shrink • Rhine River – Lost 8 of 44 fish species; 25 more endangered • Lake Chad – Diversion + drought has caused shrinkage from 25,000 to 2,000 km2 in 30 years Link • Aral Sea – Diversion for agriculture has caused severe shrinkage, with environmental & health problems L1L2
Fresh Water • Possible Solutions • World may have enough fresh water but inadequate distribution mechanism • Long pipelines and movement of icebergs have been proposed • Excessively expensive • Technological limitations
Fresh Water • Possible Solutions • Improved irrigation efficiency • Drip irrigation reduces losses from evaporation • Cuts water use by 40-60% compared to conventional systems • Used on <1% of irrigated land worldwide but used extensively in some countries (Ex – Israel uses DI on 50% of irrigated land) • Low-energy precision application (LEPA) methods apply water directly to plants • Can lower use of water and energy (20-50%) • Municipal conservation • Infrastructural losses can be substantial • Ex – 40-70% of water lost in transit in 15 major Mexican cities (similar rates in India) • Ex – Djakarta, Indonesia could cut water losses an estimated 20% by fixing leaky distribution pipes; would save ~12 billion gallons of water a year, enough to supply 800,000 people • Higher price could encourage conservation • Ex – Bogor, Indonesia increased water prices 3-4x; average household water use dropped by 30% in less than one year
Fresh Water • Possible Solutions • Reuse of urban wastewater • Use of treated wastewater for irrigation • Today, at least half a million hectares in 15 countries are being irrigated with “gray water” • More water efficient industry • Practiced in industrialized nations. • Amount of water needed to produce a ton of steel ranges from 23 to 56 m3 in China, compared to an average of less than 6 m3 in US, Japan, and Germany • Desalination • 1990 – Just over 13 million m3 of fresh water produced daily in 7,500 facilities worldwide • Provides 0.1% of global fresh water use • Current methods of desalination driven almost entirely by combustion of fossil fuels • Solar powered desalination plants are currently produce only 5,240 cubic m3d-1