Download
1 / 64
640 likes | 875 Views
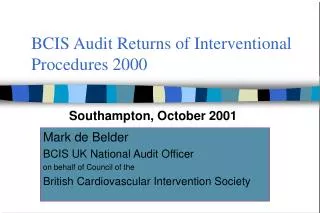
BCIS Audit Returns of Interventional Procedures 2001. Edinburgh 2002. Mark de Belder BCIS National Audit Officer on behalf of Council of the British Cardiovascular Intervention Society. UK Intervention Centres. Ayrshire & Arran stopped; Sandwell stopped;

E N D
BCIS Audit Returns of Interventional Procedures 2001 Edinburgh 2002 Mark de Belder BCIS National Audit Officer on behalf of Council of the British Cardiovascular Intervention Society
UK Intervention Centres Ayrshire & Arran stopped; Sandwell stopped; Taunton started; Heart Hospital merged with Middlesex/UCH
UK Interventional & Diagnostic Centres 2001 Making assumptions about no. of caths done in centres not reporting, estimated caths in UK approx 155,500 = 4.0caths/PCI (4.3 in 2000). 2.8caths/PCI in intervention centres (range 1.2-60, 3.5 in 2000), 2.7 in NHS centres (3.5 in 2000) and 3.7 in Private centres (unchanged)
Centres providing NO DATA The Priory Hospital, Birmingham
Centres providing NO or MINIMAL data on Centre Description Form • Royal Devon & Exeter • Wellington Hospital • Ross Hall Hospital • St Anthony’s Hospital • The Priory Hospital, Birmingham • Harley Street Clinic
No data The Priory, Birmingham Minimal Data Royal Devon & Exeter Wellington Ross Hall Hospital St Anthony’s BUPA Bristol Centres providing NO or MINIMAL DATAon Minimum Data Form
Belfast City City, Birmingham Bristol Royal Infirmary Yorkshire Heart Centre UH Wales, Cardiff London Chest Freeman, Newcastle Northern, Sheffield St Bartholomew’s Royal Devon & Exeter Derriford, Plymouth Eastbourne Wellington Ross Hall London Independent St Anthony’s The Priory, Birmingham Harley St Clinic BUPA Bristol BUPA Lea Cambridge NB Harefield, MRI, Oxford, Brompton and St Mary’s much improved! Centres with MINIMAL or NO DATAon Outcome Form
Cath Lab Data Only Belfast City City Hospital, Birmingham Blackpool Bristol Royal Infirmary Yorkshire Heart Centre Papworth Glasgow Western General Hairmyres Morriston, Swansea Eastbourne BMI Alexander, Manchester BUPA Leeds London Bridge Hospital BUPA Leicester St Anthony’sl HCI Glasgow Harley Street Clinic Unspecified Data Univ. Hosp. Of Wales Edinburgh Royal Infirmary Glasgow Royal Infirmary The London Chest Manchester Royal Infirmary Wythenshawe Heart/Middlesex/UCH Freeman, Newcastle Northern Gen. Sheffield St Bartholomew’s Royal Devon & Exeter Derriford, Plymouth Taunton Centres with no HOSPITAL Outcome Data Unspecified Data • Wellington • Cromwell • Ross Hall • London Independent • The Priory, Birmingham • BUPA Bristol • Yorkshire Clinic, Bradford • BUPA Lea, Cambridge
Number of procedures in NHS CentresTotal number of procedures per annum
Census: UK population 58.8m 663pm PCI Rates per million population (UK)
PCI vs Isolated CABG Rates (UK)Data from BCIS and SCTS Registry
NSF Targets - Some thoughts 1. To increase to 750 pm PCIs, would need a 13% growth in PCI activity 2. To increase to 750 pm CABGs*, would need a 57% growth in CABG activity 3. To increase to 1500 pm revascularisations with 500 by CABG and 1000 by PCI, would need a 5% growth in CABG and a 51% growth in PCI 1 will almost certainly occur in 2002 2 will almost certainly not occur for some years 3 is highly feasible with sufficient resources diverted to PCI * including isolated CABG and combined valve+CABG
PCI: UK 1996-2000 & 2001 vs Other European Countries 1996/2000 +44% +40% +40% +55% +180% +70% +64% +53% +19% If growth in PCI in UK continues at same rate, it will take >10 years to reach levels of PCI currently performed in France or Switzerland
Total revascularisation rates per million in European countries in 2000
PCI and CABG rates per million in European countries in 2000 2.3 3.3 5.4 2.4 4.1 3.0 1.7 1.4 2.8 2.0 0.9 4.2 1.3 1.8 1.4 2.0 0.7
Angiography and PCI rates per million in European countries in 2000 3.3 3.4 2.5 2.7 2.6 2.5 2.7 2.6 3.2 4.3 3.0 4.0 3.3 3.2 2.8 6.6 2.8
PCI numbers in UK CountriesTotal PCIs +20% -18% +16% +14% +12% -4% *Does not account for patients referred from N. Wales to English centres
PCI in UK countries 2000 and 2001PCIs/million population +17% +16% +12% -4% *Does not account for patients referred from N. Wales to English Centres
Response to the NSF?Changes in PCI Numbers by NHS centre in England 2001 vs 2000For centres performing >100 PCI’s/year
Changes in PCI Numbers by “NHS” centre in Scotland, N.Ireland & Wales 2001 vs 2000For centres performing >100 PCI’s/year Scotland N.Ireland Wales
No. of Consultant Interventionists in NHS Centres, 2001 data from 48 centres Average 6.1 / Centre (5.5 in 2000) Total 292 = 287 Cardiologists and 5 Interventional Radiologists
NHS Centres with and without Visiting Interventionists No Visitor Centres: 4.3 Interventionists/Centre, doing an average of 160 PCIs/year Visitor Centres: 4.0 Local and 3.7 Visitors/Centre, doing an average of 130 PCIs/year
No of PCIs per Consultant in NHS Centres, 2001data from 48 centres Average 126 / Consultant (125 in 2000)
Stenting in different centres 1998-20012001 data from 58 centres
Stenting and the need for emergency CABG (2001 data from 42 centres)
Stenting and procedures for restenosis (2001 data from 42 centres)
ReoPro in different centres 1999 - 20012001 data from 56 centres ReoPro used in 38% (cf 22% in 2000) 1001 cases using eptifibatide(927) or tirofiban (74) reported Total reported GP IIb/IIIa use =41%
Other procedures 2001 - 1 +, =, - : increase, no change or decrease compared to 2000 * mainly X-sizer, some Rescue device
Other procedures 2001 - 2 +, =, - : increase, no change, or decrease compared to 2000 * Mainly Angioseal
Other Procedures 2001 - 3 +, =, - : increase, no change, or decrease compared to 2000
Other Procedures 2001 - 4 +, =, - : increase, no change or decrease compared to 2000 * Some centres give combined data for ASD/PFO closure
Other Procedures 2001 - 5 +, =, - : increase, no change, or decrease compared to 2000
Other procedures 2001 - 6 +, =, - : increase, no change, or decrease compared to 2000
Aberdeen Belfast Royal Victoria Birmingham Heartlands Birmingham QE Guy’s & St Thomas’s Hammersmith Harefield* Hull Royal Infirmary King’s College Hospital Walsgrave, Coventry Edinburgh Western Liverpool CTC John Radcliffe, Oxford Brompton Glenfield Royal Free Stoke Southampton St George’s* St Mary’s* James Cook UH, Middlesbrough Nottingham City Hospital KE VIIth, Midhurst Royal Sussex County, Brighton RCH Truro Park, Nottingham Centres providing complete or near complete data on Hospital Outcome 2001 (26, cf 18 2000) * Data incomplete