Download
1 / 19
190 likes | 278 Views
TPB Tech Item # 2. 2011 Freeway Congestion Monitoring Program Findings. TPB Technical Committee December 2, 2011. Greg Jordan, SKYCOMP, Inc & Daivamani Sivasailam, DTP. Purpose

E N D
TPB Tech Item # 2 2011 Freeway Congestion Monitoring Program Findings TPB Technical Committee December 2, 2011 Greg Jordan, SKYCOMP, Inc & Daivamani Sivasailam, DTP
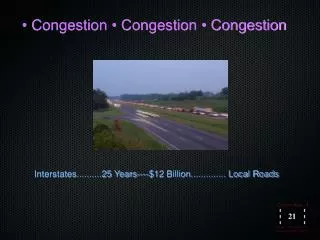
Purpose • Identify severity and extent of congestion on major highways in the region as an input to the Congestion Management Process • Identify bottlenecks, operational issues • Obtain speed, volume, delay data for model (travel demand/emissions) validation • Review trends and changes over time 2
Background (Methodology) • Congestion Monitoring once in three years since 1993 • Entire freeway system, parkways and other facilities • 4 days of overlapping pictures during 3 hours of AM and PM peak period • Vehicles counted and “Density” (passenger cars, per lane, per mile) of the facility calculated • Volume and speed estimated from Density • Levels of service estimated and reported • Performance compared with previous surveys 3
Levels of Service – Speed Chart Severe Congestion – Seen during all survey observations Volatile Congestion Spillback Zone – Severe congestion seen during some observations Marginal or Intermittent Congestion – Not severe congestion 4
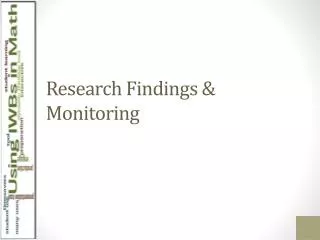
Analysis • “Top Ten” congested locations (bottlenecks) based on density • “Top Ten” congested corridors based on travel time • Improvement or degradation over time with reasons where possible • Comparisons with INRIX speed data on freeways 5
INRIX • A private provider of real-time(24/7) and historical traffic speed and travel time data on major highways since 2008 • Analysis provides daily, monthly, seasonal variations, and travel time reliability • Comparison with SKYCOMP data indicates good match on bottleneck locations (6 out of top 10) and congested corridors • Further integration of INRIX and SKYCOMP data in congestion monitoring will be studied for the future 6
AM Peak PM Peak 13
Changes to I-95 as a result of Wilson Bridge Improvements 16
Summary of Findings • Lane miles of congestion have increased significantly between 2008 and 2011, after decreasing between 2005 and 2008 • More peak spreading is occuring • Construction activity results in higher densities and lower speeds • Projects under construction(I-95 and I-495 HOT Lanes, spot improvements on I-66) should reduce delay and congestion 19