Download
1 / 5
50 likes | 124 Views
Explore the challenges and solutions in visualizing large scientific data sets over networks using RemoteViewer for 3D simulations. Learn about techniques like iso-surfaces, trajectories, data compression, and parallel realization.

E N D
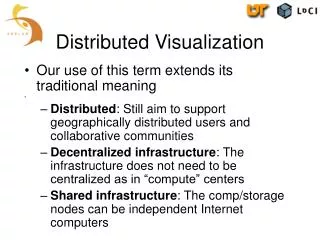
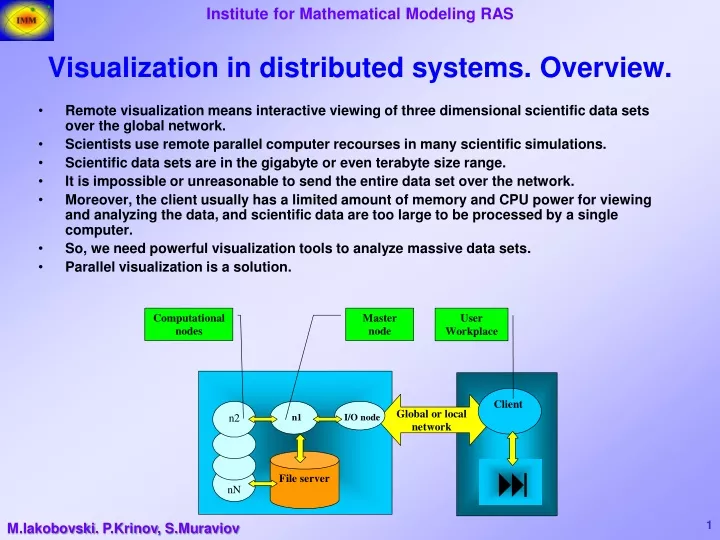
Visualization in distributed systems. Overview. • Remote visualization means interactive viewing of three dimensional scientific data sets over the global network. • Scientists use remote parallel computer recourses in many scientific simulations. • Scientific data sets are in the gigabyte or even terabyte size range. • It is impossible or unreasonable to send the entire data set over the network. • Moreover, the client usually has a limited amount of memory and CPU power for viewing and analyzing the data, and scientific data are too large to be processed by a single computer. • So, we need powerful visualization tools to analyze massive data sets. • Parallel visualization is a solution. M.Iakobovski. P.Krinov, S.Muraviov
Visualization in distributed systems. Goals. • RemoteViewer is aimed to quickly and easily process and visualize massive data sets (3D CFD simulations results). • Scalar data such as pressure or temperature may be viewed as a series of iso-surfaces and/or as a series of slices • Vector data such as the velocity field can be interactively explored using trajectories Mesh Flow over plane Iso-surfaces M.Iakobovski. P.Krinov, S.Muraviov
Visualization in distributed systems. Problem statement. Structure Visualization of Scalar and Vector fields Iso-surfaces for scalar fields Trajectories for vector field Cubic & tetrahedral meshes RemoteViewer Scalar fields visualization Vector fields visualization Data compression Parallel and grid realization RemoteViewer Tecplot M.Iakobovski. P.Krinov, S.Muraviov
Visualization in distributed systems. Issues. Scalar datavisualization methods: Syntesis & Reduction Synthesis a) Edge removal b) Node removal c) Topology refinement a) Reduction b) c) Vector datavisualization General visualization technique – geometric visualization. Main approaches Experimental analog: to the flow visualization: Path line calculations (individual trajectory) Streakline calculation (fog or smoke) Timelines calculations (coloration) Basic principle - computation of massless particle trajectories Dataanimation M.Iakobovski. P.Krinov, S.Muraviov
Visualization in distributed systems. Status. Operations on visualization server • Data processing • Iso-surfaces compression • Data transferring to the client Operations on Client • Setting of boundaries of the visual area (zoom) and resolution • Setting of basic image characteristics (number of iso-surfaces, represented on the screen, corresponding function values; number of trajectories of particles and coordinates of their starting points) • The 3D image is displayed on the client computer screen and can be explored using rotation and zooming without referring back to the server • If the closer examination of a smaller object fragment is required, the demand for image of this fragment is sent to the server • The new image can approximate the object with the higher accuracy due to the reduction in data size M.Iakobovski. P.Krinov, S.Muraviov