Download
1 / 58
600 likes | 900 Views
Symptom Management and Quality of Life at the End of Life. Susan C. McMillan, PhD, ARNP, FAAN Professor, College of Nursing Center for Hospice, Palliative Care and End of Life Studies at USF. A coalition between the University and the hospices and hospitals in the community.

E N D
Symptom Management and Quality of Life at the End of Life Susan C. McMillan, PhD, ARNP, FAAN Professor, College of Nursing Center for Hospice, Palliative Care and End of Life Studies at USF
A coalition between the University and the hospices and hospitals in the community.
Center for Hospice, Palliative Care and End of Life Studies at USF: Partners • Lifepath Hospice • Hospice of Florida Suncoast • Moffitt Cancer Center • Tidewell Hospice • Hope Hospice
Pasco County Tampa St. Petersburg Ft Myers Florida Sarasota
>6,600 Patients per day receiving care in one of these hospices. USF
Symptom Experience • Defined as: Perception and response to symptom occurrence and symptom distress. Rhodes, McDaniel & Matthews, 1998
Symptom Experience • Symptom Occurrence includes the frequency and severity with which the symptom occurs and its duration or persistence. Rhodes, McDaniel & Matthews, 1998
Symptom Experience • Symptom Distress = amount or level of physical or mental upset, anguish, or suffering experienced by a person with a specific symptom. Rhodes, et al., 1998
Symptom Experience • symptom occurrence • Symptom intensity • symptom distress. Rhodes et al., 1998
Susan McMillan, PhD, ARNP Bill Haley, PhD Brent Small, PhD Ron Schonwetter, MD Nursing Aging Studies Aging Studies Lifepath Systematic Assessment to Improve Hospice Outcomes Funded by NINR 2004-2008 Data Source
Systematic Assessment to Improve Hospice Outcomes Sites • Hernando-Pasco Hospice • Tidewell Hospice
Systematic Assessment to Improve Hospice Outcomes Patients on Admission: • Symptom intensity • Symptom distress • Depressive symptoms • Social Support • Spiritual well-being
Mean age: Male Female White African American Hispanic Other 71.8 (range 31-93) 61% 39% 95% 2% 2% 1% Demographic Data (n=161)
Lung Pancreas Colon Prostate Liver Breast Lymphoma Other 31% 12% 7% 6% 6% 4% 4% 30% Most Common Cancers: N=161
1994 (n=31) 1996 (n=118) 1999 (n=242) 2000 (n=231) 2002 (n=70) Lung, Prostate, Colorectal Lung, Colorectal, Prostate Lung, Prostate, Colorectal Lung, Colorectal, Breast, Prostate Lung, Colorectal, Breast, Pancreas Hospice Samples ’94-’02Most Common Cancers
Symptom Experience Symptom Occurrence Data from Memorial Symptom Assessment Scale-Hospice
Fatigue Pain Dry Mouth Drowsy Appetite Dyspnea (SOB) Constipation Cough Sleep disturbance Numbness and tingling 85% (89%) 85% (83%) 71% (78%) 59% 59% 54% 45% 45% 43% 43% Most Common Symptoms: 2006 2002 Same top 3!
Fatigue Pain Dry Mouth Dyspnea (SOB) Constipation Hospice Active Treatment 85% *73% 85% *63% 71% *55% 54% *22% 45% 87% Most Common Symptoms: *Portenoy et al., 1994
Fatigue Pain Dry Mouth Appetite Dyspnea (SOB) Constipation Cough Sleep disturbance 85% 90% 73% 67% 71% 50% 59% 17% 54% 57% 45% 27% 45% 53% 43% 47% Most Common Symptoms: Cancer Cardiac ‘06 Swelling 57% MSAS-HF n=31
Feeling Sad Worrying Difficulty Concentrating Nausea Feeling Bloated Feel nervous Urination problems 41% 38% 36% 31% 31% 29% 27% Cancer Less Commonly Reported:
25% 22% 22% 17% 15% 12% Feel irritable Swallowing difficulty Itching Vomiting Sexual problems Diarrhea Least Commonly Reported:
Symptom Experience Symptom Severity or Intensity
Fatigue Appetite Constipation Pain Sleep Dyspnea Drowsy Dry mouth Numbness/Tingling Cough 2.7 SD=1.0 2.6 SD=1.1 2.5 SD=1.1 2.3 SD=1.1 2.3 SD=1.0 2.2 SD=1.1 2.1 SD=1.0 1.9 SD=1.0 1.9 SD=1.0 1.7 SD=0.9 Among the 10 Most Common Symptoms HighestMeanSeverityLevels (1-4)
Pain at Its Worst (0-10) • 14% = No pain • 7% = 1 to 4 • 78% = 5 to 10 HQLI ‘06
Symptom Experience Symptom Distress or Bother
(n=178 hospice patients with cancer)Found total distress score from MSAS-H was the best predictor of overall quality of life (p=.001) accounting for 35% of variance. Relationship betw. Symptom Distress and Quality of Life (McMillan & Small, 2002)
Fatigue Constipation Pain Appetite Sleep Dyspnea Drowsy Numbness/Tingling Cough Dry mouth Distress Intensity 2.5 (2.7) 2.5 (2.5) 2.4 (2.3) 2.2 (2.6) 2.2 (2.3) 2.1 (2.2) 2.1 (2.1) 1.8 (1.9) 1.7 (1.7) 1.5 (1.9) 10 Most Common Symptoms Highest MeanDistressLevels (0-4)
Fatigue Constipation Pain 55% 52% 49% 3 Most Distressing Symptoms Percent of Patients with Distress @ Levels of 3 or 4 Top Three
Depressive Symptoms CES-D (SF) Scores (0-10) Mean = 2.9; SD = 0.3 • 33% no symptoms • 31% had symptoms • 38% reach cut-off of 4; (have a high probability of depressive disorder)
Social Support: Patients High satisfaction early in hospice experience; 94% marked “very satisfied”
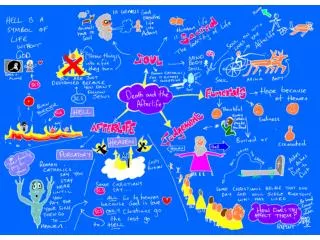
Non-Catholic Christian Catholic Jewish Shamanism None 52% 31% 2.5% 0.6% 13% Religious Affiliation
Be with family See smiles of others Think happy thoughts Laugh Talk about day to day things Be with friends 80 71 71 65 63 52 Spiritual Needs% Marking as Always/Frequently a Need Less than 5% identified these as unmet needs
Most Common Unmet Need Attend religious services 21%
Our Preliminary Work • Surveyed hospice nurses to learn how often they depend on CGs for patient symptom data; • Result: When patient is alert and oriented, they ask the CG 85% of the time. How dependable is that data?
How lonely you feel Hope Tired Worried or distressed How sad you feel How well you sleep Pain relief you get How well you eat .31 .003 .37 .000 .37 .000 .40 .000 .42 .000 .47 .000 .51 .000 .66 .000 HQLI Correlations Between Pts - Caregivers Item r p
How lonely you feel Hope Tired Worried or distressed How sad you feel How well you sleep Pain relief you get How well you eat .31 9.6% .37 13.7% .37 13.7% .40 16.0% .42 17.6% .47 22.0% .51 26.0% .66 43.6% HQLI Correlations Between Pts - Caregivers Item r r2
Before the Development of the Center: • Quality of Life Research conducted at local hospices; • Allowed evaluation of what aspects of quality of life were most important to cancer patients receiving hospice homecare.
SYMPTOMS How tired Pain relief Dyspnea Sleep Constipation FEELINGS: Anxious Sad Hope RELATIONSHIPS: Support from family/ friends Support from hospice team Relationship with God Physical contact with loved ones HQLI What isImportant to Patients?
MOST Important to Patients Percent • Relationship with God 87 • Support from family/friends 86 • Surroundings (home) 83 • Physical care receiving 81 • Hope 81 • Support from hospice team 80 • Physical contact w. loved ones 79
LEAST Important to Patients Percent • Sexuality 26 • How tired you are 29 • Usual amount of work can do 29 • Anxious re: family/friends 36 • How well you eat 40
Hospice Focuses on Pain! • Pain severity ranked 4th • Pain distress ranked 3rd • Pain relief importance NOT near top!
Hospice Focuses on Pain! • Pain severity ranked 4th • Pain distress ranked 3rd • Pain relief importance not near top! While pain management is important, we need to continue to focus on other issues as well.
A Caregiver Intervention to Improve Hospice Outcomes Funded by NIH 1999-2004 SC McMillan, PI
Co-investigators: • Michael Weitzner, MD - Moffitt Cancer Ctr. • Bill Haley, PhD - Sch. of Aging Studies • Linda Moody, PhD, RN - College of Nursing • Ron Schonwetter, MD - Geriatric Medicine • Mary Tittle, PhD, RN - College of Nursing • Brent Small, PhD - Sch. of Aging Studies • Ann Holzheimer, ARNP - LifePath Hospice Funded by NCI & NINR 1R01-CA77307
Problems: Accrual & Attrition • Screened every patient admitted to the hospice and accrued <5% to study; • Attrition by Time 2 was 50%; • Attrition by Time 3 was 70%.
Aim 2: To examine the impact of a problem solving intervention (COPE) on quality of life of hospice patients with cancer.
Study Sample: • 328 hospice patients • Divided into 3 groups • Inclusion: adults, with cancer, in homecare with a family caregiver, literate, cognitively intact.
Memorial Symptom Assessment Scale (MSAS-H)* • Assesses distress as a result of patient symptoms • 24-item self-report scale • Items rated 0-4 • Range 0-96 *Modified for hospice patients.
Symptom Intensity • Pain numeric rating scale (0-10) (Single item) • Dyspnea numeric rating scale (0-10) (Single item) • Constipation Assessment Scale (0-16) (8 items)
Quality of Life • Hospice Quality of Life Index (HQLI) (28 items) • Validated on hospice patients with cancer.