Download
1 / 12
120 likes | 236 Views
Set of gel images for analysis. Healthy Control. Case. 2D gel images of Serum protein sample. Steps followed in gel analysis. 1) Set up Project 2) Detect and Quantify Spots 3) Analyze Expression Profiles 4) Present Results. ANALYSIS, RESULT AND DATA INTERPRETATION.

E N D
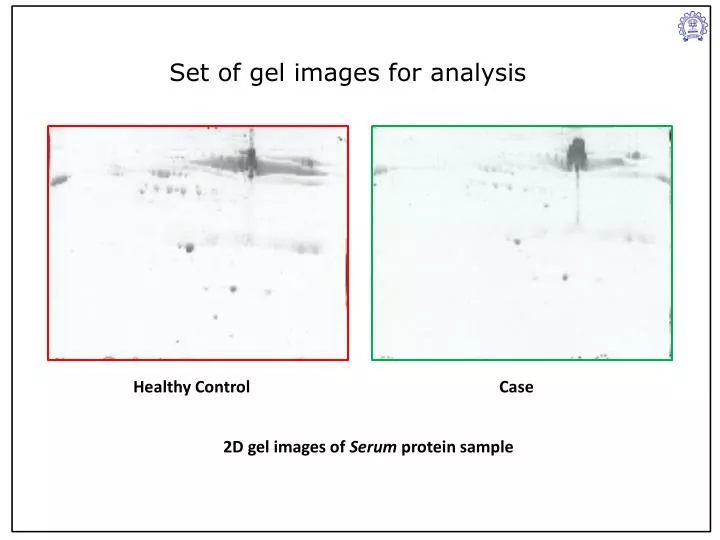
Set of gel images for analysis Healthy Control Case 2D gel images of Serum protein sample
Steps followed in gel analysis 1) Set up Project 2) Detect and Quantify Spots 3) Analyze Expression Profiles 4) Present Results
ANALYSIS, RESULT AND DATA INTERPRETATION
1. Project Summary: Groups Control(1 image) Control - Healthy person 349spots transferred from fused image 97 spots cancelled Diseased (1 image) P.falciparum diseased serum sample 349 spots transferred from fused image 97 spots cancelled Vector Matching : 109
1. Project Summary: Profile Spot Information Control Diseased Spot ID : 1999 pI : 5.26 MW : 65.1kDal 3D view 3D view Control P.fal Fused Spot ID : 2082 pI : 5.28 MW : 44.8kDal 3D view 3D view Control P.fal Fused
3.Figure showing Molecular weight to pI pI index Molecular weight (kDal) Spot ID: 2082 pI : 5.28 Mol. weight : 44.8 kDal Spot ID: 1999 pI : 5.26 Mol. weight : 65.2 kDal
4.1. Differential expression : Up regulation Up regulation x Folds or above No. of spots showing up regulation
4.2. expression profile: Up regulation(8-10 folds up) -11 spots Mean normalized value of group 2 (P.falciparum diseased person) Ratio = Mean normalized value of group-Control(Healthy person)
4.3.Differential expression : Down regulation Down regulation x Folds or above No. of spots showing up regulation
4.4.Expression profile: Down regulation(9-10 folds down) - 9 spots Mean normalized value of group 2 (P.falciparum diseased person) Ratio = Mean normalized value of group-Control(Healthy person)
5.Cluster Analysis Hierarchical Cluster Analysis HCL Tree It helps in finding correlated protein It provides information about similarly expressed protein.