Download
1 / 1
10 likes | 210 Views
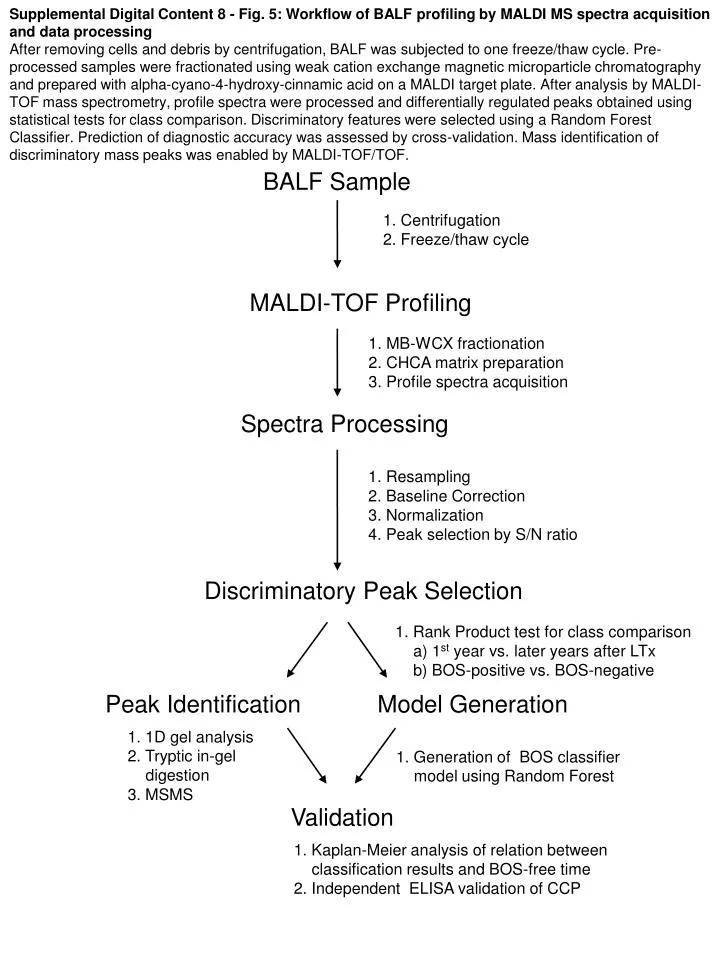
Supplemental Digital Content 8 - Fig. 5: Workflow of BALF profiling by MALDI MS spectra acquisition and data processing

E N D
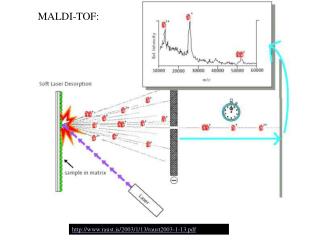
Supplemental Digital Content 8 - Fig. 5: Workflow of BALF profiling by MALDI MS spectra acquisition and data processing After removing cells and debris by centrifugation, BALF was subjected to one freeze/thaw cycle. Pre-processed samples were fractionated using weak cation exchange magnetic microparticle chromatography and prepared with alpha-cyano-4-hydroxy-cinnamic acid on a MALDI target plate. After analysis by MALDI-TOF mass spectrometry, profile spectra were processed and differentially regulated peaks obtained using statistical tests for class comparison. Discriminatory features were selected using a Random Forest Classifier. Prediction of diagnostic accuracy was assessed by cross-validation. Mass identification of discriminatory mass peaks was enabled by MALDI-TOF/TOF. BALF Sample 1. Centrifugation 2. Freeze/thaw cycle MALDI-TOF Profiling 1. MB-WCX fractionation 2. CHCA matrix preparation 3. Profile spectra acquisition Spectra Processing 1. Resampling 2. Baseline Correction 3. Normalization 4. Peak selection by S/N ratio Discriminatory Peak Selection 1. Rank Product test for class comparison a) 1st year vs. later years after LTx b) BOS-positive vs. BOS-negative Peak Identification Model Generation 1. 1D gel analysis 2. Tryptic in-gel digestion 3. MSMS 1. Generation of BOS classifier model using Random Forest Validation 1. Kaplan-Meier analysis of relation between classification results and BOS-free time 2. Independent ELISA validation of CCP