Download
1 / 1
10 likes | 127 Views
Ejecta Time: 10/29 1117 UT – 10/30 0349 UT Cone angle: 113 deg Clock angle: 266 deg (clockwise from positive Y) Axial Field: B z0 = 45 nT Magnetic Helicity: Negative. GSE Z. Clock angle. GSE Y. Orientation of the Ejecta was 266 deg.

E N D
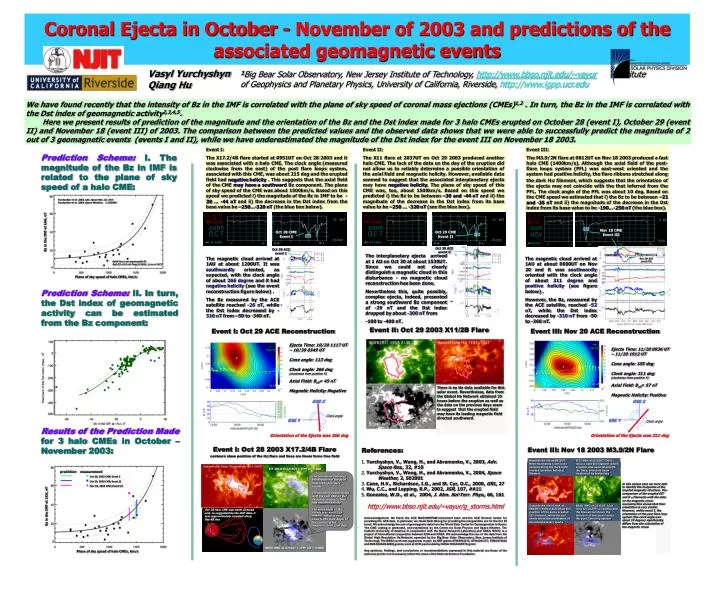
Ejecta Time: 10/29 1117 UT – 10/30 0349 UT Cone angle: 113 deg Clock angle: 266 deg (clockwise from positive Y) Axial Field: Bz0= 45 nT Magnetic Helicity: Negative GSE Z Clock angle GSE Y Orientation of the Ejecta was 266 deg Coronal Ejecta in October - November of 2003 and predictions of the associated geomagnetic events Vasyl Yurchyshyn Qiang Hu 1Big Bear Solar Observatory, New Jersey Institute of Technology, http://www.bbso.njit.edu/~vayur2Institute of Geophysics and Planetary Physics, University of California, Riverside, http://www.igpp.ucr.edu We have found recently that the intensity of Bz in the IMF is correlated with the plane of sky speed of coronal mass ejections (CMEs)1,2 . In turn, the Bz in the IMF is correlated with the Dst index of geomagnetic activity2,3,4,5. Here we present results of prediction of the magnitude and the orientation of the Bz and the Dst index made for 3 halo CMEs erupted on October 28 (event I), October 29 (event II) and November 18 (event III) of 2003. The comparison between the predicted values and the observed data shows that we were able to successfully predict the magnitude of 2 out of 3 geomagnetic events (events I and II), while we have underestimated the magnitude of the Dst index for the event III on November 18 2003. Event I: The X17.2/4B flare started at 0951UT on Oct 28 2003 and it was associated with a halo CME. The clock angle (measured clockwise from the east) of the post flare loops system, associated with this CME, was about 215 deg and the erupted field hadnegative helicity . This suggests that the axial field of the CMEmay have a southward Bzcomponent.The plane of sky speed of the CME was about 1500km/s. Based on this speed we predicted i) the magnitude of the Bz in IMF to be-30 … -44 nTand ii) the decrease in the Dst index from the base value be –250…-320 nT (the blue box below). Event II: The X11 flare at 2037UT on Oct 29 2003 produced another halo CME. The lack of the data on the day of the eruption did not allow us to reliably determine a possible orientation of the axial field and magnetic helicity. However, available data seemed to suggest that the associated interplanetary ejecta may have negative helicity. The plane of sky speed of this CME was, too, about 1500km/s. Based on this speed we predicted i) the Bz to be between –30 and -44 nTand ii) the magnitude of the decrease in the Dst index from its base value to be –250 … -320 nT (see the blue box). Event III: The M3.9/2N flare at 0812UT on Nov 18 2003 produced a fast halo CME (1400km/s). Although the axial field of the post-flare loops system (PFL) was east-west oriented and the system had positive helicity, the flare ribbons stretched along the dark H filament, which suggests that the orientation of the ejecta may not coincide with the that inferred from the PFL. The clock angle of the PFL was about 10 deg. Based on the CME speed we estimated that i) the Bz to be between –21 and -35 nTand ii) the magnitude of the decrease in the Dst index from its base value to be -190…-250 nT (the blue box). Prediction Scheme:I. The magnitude of the Bz in IMF is related to the plane of sky speed of a halo CME: Yurchyshyn et al. 2003, Adv. Space Res. 32, #10 Yurchyshyn et al. 2004, Space Weather, 2, S02001 Nov 18 CME Event III Oct 28 CME Event I Oct 29 CME Event II Bz in the IMF at 1AU, nT Oct 30 ACE event iI Oct 29 ACE event I The interplanetary ejecta arrived at 1 AU on Oct 30 at about 1530UT. Since we could not clearly distinguish a magnetic cloud in this disturbance - no magnetic cloud reconstruction has been done. Nevertheless this, quite possibly, complex ejecta, indeed, presented a strong southward Bz component of -29 nT and the Dst index dropped by about -300 nT from -100 to -400 nT. The magnetic cloud arrived at 1AU at about 1200UT. It wassouthwardlyoriented, as expected, with the clock angle of about266 degreeand it hadnegative helicity (see the event reconstruction figure below) . The Bz measured by the ACE satellite reached-26 nT, while the Dst index decreased by -310 nTfrom –50 to -360 nT. The magnetic cloud arrived at 1AU at about 0600UT on Nov 20 and it wassouthwardlyoriented with the clock angle of about311 degreeand positive helicity (see figure below) . However, the Bz, measured by the ACE satellite, reached-52 nT, while the Dst index decreased by -310 nTfrom -50 to -360 nT. Solid line is an exponential fit Bz[nT]=12.3+0.7exp(V/404). (r.m.s=7nT) Nov 20 ACE event III Plane of sky speed of halo CMEs, km/s Prediction Scheme:II. In turn, the Dst index of geomagnetic activity can be estimated from the Bz component: Event II: Oct 29 2003 X11/2B Flare Event I: Oct 29 ACE Reconstruction Event III: Nov 20 ACE Reconstruction Ejecta Time: 11/20 0936 UT – 11/20 1912 UT Cone angle: 105 deg Clock angle: 311 deg (clockwise from positive Y) Axial Field: Bz0= 57 nT Magnetic Helicity: Positive There is no Ha data available for this solar event. Nevertheless, data from the Global Ha Network obtained 10 hours before the eruption as well as the data on the previous days seem to suggest that the erupted field may have its leading magnetic field directed southward. GSE Z GSE Y Clock angle Results of the Prediction Made for 3 halo CMEs in October – November 2003: Orientation of the Ejecta was 311 deg Event I: Oct 28 2003 X17.2/4B Flare contours show position of the H flare and lines are linear force free field References: Event III: Nov 18 2003 M3.9/2N Flare 1. Yurchyshyn, V., Wang, H., and Abramenko, V., 2003, Adv. Space Res., 32, #10 2. Yurchyshyn, V., Wang, H., and Abramenko, V., 2004, Space Weather, 2, S02001 3. Cane, H.V., Richardson, I.G., and St. Cyr, O.C., 2000, GRL, 27 4. Wu, C.C., and Lepping, R.P., 2002, JGR, 107, #A11 5. Gonzalez, W.D., et al., 2004, J. Atm. Sol-Terr. Phys., 66, 161 Kanzelhohe Ha at 0818UT: Note Ha ribbons (contours) running along the dark right handed (positive helicity) filament EIT 195A at 0713UT: Dots trace a dark EIT filament which eruption was associated with the flare, blue dots show location of its footpoints EIT 195 A at 1313UT + LFFF a=-0.008 prediction measurement The blue arrow indicates the direction of the axial field in the post flare arcade. This arcade was associated with the halo CME on Oct 28 and its magnetic field had negative helicity. The clock angle of this arcade was about 215 degree, which is very close to the clock angle of the reconstructed magnetic cloud (266 deg). Oct 28, 2003 CME; Event I Oct 29, 2003 CME; Event II In this unique case we were able to identify the footpoints of the erupted magnetic structure. The comparison of the erupted EIT and H filaments with the data on the magnetic cloud reconstruction shows that their orientation is very similar. However, unlike event I, the orientation of the post flare loop system (the clock angle was about 10 degree) significantly differs from the orientation of the magnetic cloud. Nov 18, 2003 CME; Event III http://www.bbso.njit.edu/~vayur/g_storms.html Kanzelhohe Ha+0.44A at 0814UT: Yellow dots show the position of the same erupted EIT filament, while the red arrow show the orientation of the interplanetary ejecta. BBSO DMG at 2015UT: blue lines are a LFFF (=0.002) and the blue arrow shows the direction of the axial field in the post flare loop system Bz in the IMF at 1AU, nT Oct 28 Halo CME was earth directed and, as suggested by the ACE data, it was approximately oriented along the NS line EIT 195 A at 1313UT + LFFF a=-0.008 Acknowledgement: We thank the ACE MAG/SWEPAM instrument team and the ACE Science Center for providing the ACE data. In particular, we thank Ruth Skougfor providing the merged data set for the Oct 30 event. We acknowledge the use of geomagnetic data from the World Data Center for Geomagnetism in Kyoto. The CME catalog is generated, and maintained, by the Center for Solar Physics and Space Weather, The Catholic University of America in cooperation with the Naval Research Laboratory and NASA. SOHO is a project of international cooperation between ESA and NASA. We acknowledge the use of the data from the Global High Resolution Ha Network, operated by the Big Bear Solar Observatory, New Jersey Institute of Technology. The BBSO work was supported, in part, by NSF grants ATM-9903515, ATM-0205157, ATM-0076602 and NASA(NAG5-9682) grants; work at UCR was funded by NASA NNG04GF47G grant . Any opinions, findings, and conclusions or recommendations expressed in this material are those of the author(s) and do not necessarily reflect the views of the National Science Foundation. BBSO DMG at 1716UT + LFFF ( =-0.008) Plane of sky speed of halo CMEs, km/s