Download

1 / 29
290 likes | 305 Views
This study provides formulas and methodology for estimating sample size to determine the accuracy of two diagnostic tests using the Hui-Walter model. It covers assumptions, parameter estimation, confidence intervals, and considerations for calculation of sample sizes. The research is valuable for comparing test sensitivities and specificities.

E N D
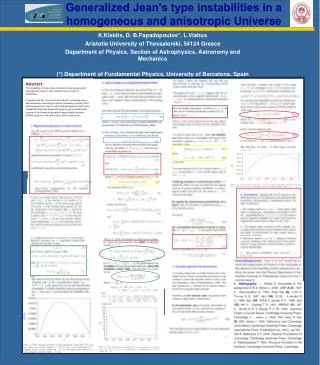
Sample size determination for estimation of the accuracy of two conditionally independent diagnostic tests Marios Georgiadis, Faculty of Veterinary Medicine, Aristotle University of Thessaloniki, Greece
this work was done by • Wes Johnson, University of California, Davis • Ian Gardner, University of California, Davis • Marios Georgiadis, Aristotle University of Thessaloniki
Assumptions • Validity of the assumptions is critical and should be given careful consideration • 1# 2 • Each test has the same Se-Sp in the two populations • Conditional independence (Vacek, 1985)
sample size estimation using HW • data from 2-tests applied on 2-populations • goal is to estimate Se1, Se2, Sp1, Sp2, 1, 2 • minimum sample size to achieve a desired level of precision • the method provides sample sizes to obtain CI’s of a specified maximum width for one or more of the 6 parameters • alternatively, we can specify CI widths for the difference in sensitivities (Se1-Se2) and specificities (Sp1-Sp2)
HW estimates and CI’s • HW provided closed-form formulas for the ML estimates for the two Se’s, the two Sp’s and the two prevalences (6 parameters) • using these formulas with our 2-table data we get ML point estimates for the six parameters of interest • these point estimates are the points of the (6-dimensional) parameter space for which the likelihood function is maximized
once we get the FIM we can invert it to obtain the estimated variance-covariance matrix • the diagonal elements of this matrix are the standard large-sample estimates of the variances of the respective parameter estimates • The square roots of the diagonals are the usual s.e.’s • off-diagonal elements are the corresponding estimated covariances
once we have the standard errors we can calculate CI’s • we need the assumption of asymptotic normality of the ML estimates - large sample sizes • rule of thumb: ML estimate 3*s.e. should not cover 0 or 1 • if the assumption does not hold we cannot calculate CI’s in the usual way
estimation of the differences: Se1-Se2 and Sp1 –Sp2 • an objective of the study might be to compare the sensitivities or the specificities of the tests • the point estimate of the differences is the difference of the point estimates • the estimated variances of the difference estimates are:
all the necessary estimated variances and covariances can be obtained from the estimated variance-covariance matrix • the standard error of the difference is the square root its estimated variance • if the asymptotic normality assumption holds we can create CI’s as before
calculation of sample size • if the sampling distribution of an estimator is approximately normal then the (1-)*100% CI is
the width (w) of this CI is • solving for N, we get: • to calculate the sample size, N, we need an estimate of s
if the largest sample size is picked, all the CI widths will be as specified or smaller • estimation of only a subset of parameters might be of interest • prevalence estimates are not usually of interest • some performance estimates might be known • information on these is used in the spreadsheet but their CI widths are set arbitrarily large
for some combinations of parameter values the diagonals of C and can be negative • this is because these parameter values result in a singular information matrix • we have to make sure that we do not have negative diagonals or very large pairwise correlation values (close to or over 1 or -1) • another indication is that the sample sizes will become very large • in these situations, the usual ML method cannot be used to obtain s.e.’s and therefore our sample size calculations are not applicable
it’s a good idea to try some combinations of parameter guesses to make sure you are not near a problematic area of the parameter space • the same potential problems and warnings can be found in spreadsheet 2
initial parameter guesses • guesses of the 6 parameters of interest are necessary • since the sample size calculation is strongly dependent on those they have to be realistic • expert opinion - be careful: • sensitivity can vary with severity of infection and stage of disease process • sensitivity of a test with experimental samples might be higher than with real field samples • specificity can vary according to geographic distribution of cross-reacting microorganisms
best to do a pilot study • calculate sample sizes for a range of possible parameter values
if you wanted to conduct an evaluation study • if you want to use the HW model: first make sure that the assumptions hold • tests conditionally independent • populations have different prevalences • test performance the same in both populations • sample size calculations – precision and cost considerations • specify up front how much precision we need
formulate educated guesses for the parameters of interest (expert opinion and/or pilot study) • use spreadsheet 1 to get sample sizes • check to see if the large-sample approximation is reasonable by calculating the initial estimate/guess ±3*s.e. to determine if the interval obtained includes 0 or 1 • if it does, the sample is likely not large enough to justify large-sample normality
during the calculation process we should monitor the diagonals of matrix C and the pairwise correlations and be careful about the “singular information matrix” problem
conduct the study • insert raw data into spreadsheet 3 to get parameter estimates • use parameter estimates in spreadsheet 2 to get standard errors • if large sample theory holds, we can calculate CI’s for the parameters of interest • again, monitor information matrix diagonals and pairwise correlations
dependent tests • if the tests are conditionally dependent, we can still use the HW setup but we will need different methods of analysis of our results • since there are no sample-size calculation methods for such tests, we can still use our method, knowing that to obtain comparable precision we will probably need larger sample sizes • the calculated sizes can be used as an absolutely minimum value