Download
1 / 29
290 likes | 368 Views
CHAPTER 12: COMPARATIVE DATA, FORECASTS, & BENCHMARKING. Part V: Plan, Monitor and Control Financial Operations. Using Comparative Data. Managers use comparative data to set common ground for planning, control and decision-making purposes. Common Sizing.

E N D
CHAPTER 12: COMPARATIVE DATA, FORECASTS, & BENCHMARKING Part V: Plan, Monitor and Control Financial Operations
Using Comparative Data Managers use comparative data to set common ground for planning, control and decision-making purposes.
Common Sizing Common sizing puts data on the same relative basis.
Common Sizing: Example Common sizing converts numbers to percentages so that comparative analysis can be preformed. The worksheet below shows the assets of two hospitals.
20% 75% 5% 100% 20% 75% 5% 100% Common Sizing: Practice
Trend Analysis Trend analysis compares figures over several time periods.
Trend Analysis: Example Trend analysis allows comparison of figures over time.
Hospital A Hospital A Year 1 Year 1 Year 2 Year 2 Difference Current Assets Property, Plant & Equipment Other Assets Total Assets Current Assets Property, Plant & Equipment Other Assets Total Assets $1,600,000 6,000,000 400,000 $8,000,000 $1,600,000 6,000,000 400,000 $8,000,000 $ 2,000,000 7,500,000 500,000 $10,000,000 $ 2,000,000 7,500,000 500,000 $10,000,000 $ 400,000 1,500,000 100,000 $2,000,000 25% 25% 25% Trend Analysis: Practice
Comparative Analysis of Operating Data Horizontal Analysis Usually involves converted $ to %. Called “horizontal analysis” because computation of the % is across, or horizontal. Refer to examples in this chapter.
Comparative Analysis of Operating Data Vertical Analysis Usually involves converted $ to %. Called “vertical analysis” because computation of the % is up and down, or vertical. Refer to examples in the chapter.
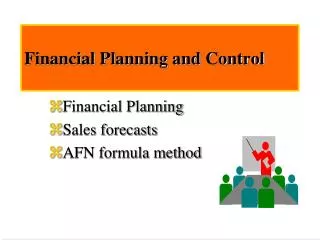
Forecasting Results Managers can use three levels of forecasts: Short Range — Next year Intermediate Range — 5 years from today Long Range — The next decade and beyond
Forecasting Results Assumptions affect forecasted results. Assumptions are the basis of the numbers in your forecast. Example: Computing a staff requirement of 3 lab technicians requires an assumption. Computing the salary and fringe benefits for each of the technicians requires another assumption. When the salary and fringe benefit dollars are computed for the 3 lab technicians, the resulting figure becomes part of your forecast.
Forecasting Results Assumptions can be determined by Trend Analysis Payer Changes Utilization Changes
Forecasting Results Managers often have to prepare staffing forecasts Watch for Non-Controllable Expense Problems Capacity Problems Labor Market Problems More details are in the chapter.
Forecasting Results And always remember: Forecasting is an important part of the budget process.
Other Performance Measures A variety of performance measures must be in place for the organization. Many types of such measures are available. Generally different organizations lean toward using one type over another.
Other Performance Measures Adjusted performance measures over time. We have previously discussed the advantages of comparative analysis — the comparison of various time periods, one to another. Measures that compare performance over various time periods are especially effective. Figure 12-2 illustrates measures over time combined with a 2-part case mix adjustment.
Other Performance Measures Financial Benchmarking Benchmarking is the continuous process of measuring products, services, and activities against the best levels of performance. The best levels may be found inside the organization or outside it.
Benchmarking There are 3 types of benchmarks A financial variable reported in an accounting system. A financial variable not reported in an accounting system. A nonfinancial variable. Benchmarks are used to measure performance gaps.
Benchmarking How do you benchmark? Three possible methods include: Studying the methods and results of your prime competitors; Examining the process of noncompetitors with a world-class reputation; or Analyzing processes within your own organization that are worthwhile to replicate.
Benchmarking Financial benchmarking compares financial measure among benchmarking groups. It is the most common type of peer group method used in health care. (Statistical benchmarking is another related method.) See Table 12-6 for an example of financial benchmarking.
Measurement Tools Pareto analysis is a measurement tool based on the Pareto Principle. The Pareto Principle is often called the “80/20 Rule.” For example, “80% of an organization’s problems are caused by 20% of the possible causes.”
Measurement Tools Pareto Analysis is an analytical tool that aids managers to improve some steps in a process. The analysis quantifies these steps through construction of a Pareto diagram. Figure 12-3 and accompanying text explain how to construct and interpret a Pareto diagram.
40 100% 30 20 Number 36.37 Activity Number % PDB 12 36.37 RWS 10 30.30 LD 6 18.18 CD 5 15.15 33 100% 10 0 PDB RWS LD CD Pareto Rule: Solution
Measurement Tools Reporting by quartiles is an effective way to show ranges of either financial or statistical results. Quartiles are based on a quantitative method of computation and can effectively illustrate a variety of performance measures. Chapter text plus Table 12-6 illustrate how to compute and construct a report using quartiles.
Total Patient Days • 1 Sarasota Memorial 110,033 110,033 High/Maximum • 2 Naples Community Hospital 80519 • 3 Southwest Florida Reg. Medical Ctr. 57,984 • 4 Lee Memorial Hosp-Cleveland 55,305 • 5 Lee Memorial Hosp-Healthpark 45,510 56,645 Third Quartile • 6 Bon Secours-Venice Hospital 43,608 • 7 Cape Coral Hospital 41,630 • 8 Columbia Doctors Hosp of Sarasota 38,320 • 9 Fawcett Memorial Hospital 35,998 35,998 Median • 10 St. Joseph Hosp of Port Charlotte 34,697 • 11 Charlotte Regional Medical Center 25,985 • 12 Englewood Community Hospital 19,763 • 13 North Collier Hospital 17,121 17,121 First Quartile • 14 Gulf Coast Hospital 14,759 • 15 Desoto Memorial Hospital 9,313 • 16 East Pointe Hospital 9,026 • Hendry Regional Medical Center 4,380 4,380 Low/Minimum • Total 643,951 Quartiles: Solution
Performance Measures Remember, several types of performance measures will be in use in the organization. Familiarity with the use of such measures lets the manager do a better job analyzing performance.