Download
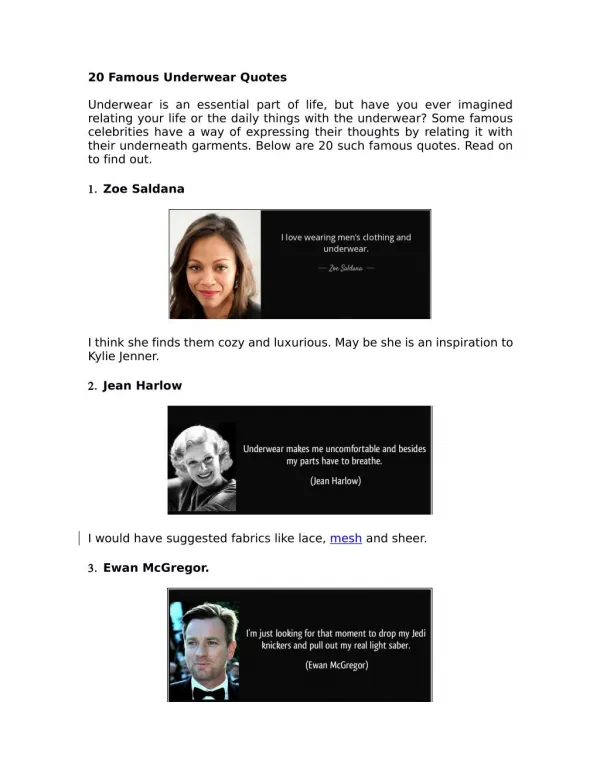
1 / 11
170 likes | 583 Views
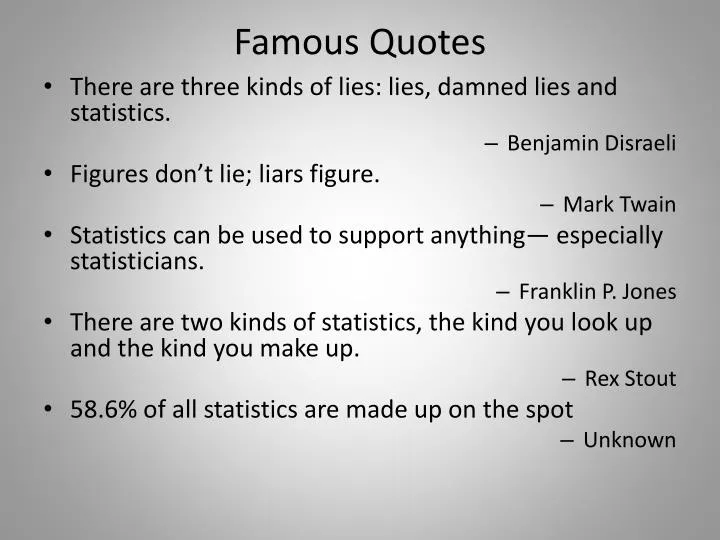
Famous Quotes. There are three kinds of lies: lies, damned lies and statistics. Benjamin Disraeli Figures don’t lie; liars figure. Mark Twain Statistics can be used to support anything― especially statisticians. Franklin P. Jones

E N D
Famous Quotes • There are three kinds of lies: lies, damned lies and statistics. • Benjamin Disraeli • Figures don’t lie; liars figure. • Mark Twain • Statistics can be used to support anything― especially statisticians. • Franklin P. Jones • There are two kinds of statistics, the kind you look up and the kind you make up. • Rex Stout • 58.6% of all statistics are made up on the spot • Unknown
Literary Digest Poll • Literary Digest correctly predicted the presidential election winner from 1916 to 1932. • In 1936, they incorrectly predicted that Alf Landon would defeat FDR. • 10 Million ballots sent out • Landon chosen on 1,293,669 ballots • FDR received 972,897 ballots • Landon received 57% of returned ballots • FDR won the general election in a landslide
Where did Literary Digest go wrong? • They had a truly huge sample size (> 2M responses), but was their sample representative of the voters as a whole? • The Gallup poll only used 50,000 subjects and accurately predicted the winner. What the Heck?
Rule of Large Numbers • Larger sample size will typically lend more precision, but care must be taken to ensure that the sample is representative of the whole. • Voluntary responses are suspect. • Why would the sample of respondents from Literary Digest be so different than the nation as a whole? The ballots were sent to subscribers, car owners and telephone owners. They tended to be more affluent, and tended to be Republican. • Why did Gallup’s sample give a better response?
Correlation and Causality • Just because two things are correlated does not mean that one causes the other • 100 people were asked two questions. The first was if they have taken pain relievers in the last week. The second was if they has a headache in the last week. 36 answered yes to question 1 and 31 answered yes to question 2. • The percentages that answered yes to each question were very similar, so we could say that they are correlated. • Therefore, we assume that taking pain relievers will give you a headache, right? WRONG!!!!
Reporting Results • People often report what they think they should answer instead of the truth. • Questions such as weight, age, voting history, charitable contributions, volunteerism, etc. • Example: 1002 eligible voters were surveyed and 70% stated that they had voted in the presidential election. • Actual figures were closer to 61% • Is 9% difference a big deal?
Misuse of Percentages • A start-up company held 5% of the market share of their product after year one. • After year 2, they held a 10% market share. • In a press release, they claimed that they had a 100% increase in market share from year to year. (5% net increase vs. 5% previous share). Is this accurate? • What if we compared year to year the market share they didn’t have (95% vs. 90%). (95-90)÷ 95 is around 5.3% change. Is that a better way to look at it?
Misleading wording • Should the president have the line item veto, or not? 57% yes • Should the president have a line item veto to eliminate waste? 97% yes • Too little money spent on welfare • 19% agreed • Too little money is spent on assistance to the poor • 63% agreed
Order of questions • The following questions were asked in a German poll: • Would you say that traffic contributes more or less to air pollution than industry? • Would you say that industry contributes more or less to air pollution than traffic? When Traffic was listed first, 45% blamed traffic and 27% blamed industry. When industry was listed first, 57% blamed industry and 24% blamed traffic.
Other problems with survey data • Non-response: Refusal to respond or unavailability. The refusal rate is growing because of distrust of telemarketers. • People that refuse to answer often have different responses than those that do not. What is the corresponding population that is sampled? • Missing Data: Many sources, such as non-response or drop-out. • What can be done? • Self-interest study: “According to a nationwide survey of 250 hiring professionals, scuffed shoes was the most common reason given for a male job-seeker’s failure to make a good first impression.” Kiwi Brands sponsored.
Homework • Reading assignment: p. 2-17 in your statistics book. Know the terms on page 15. • Short quiz on vocab and on