Download
1 / 2
20 likes | 143 Views
TI 83/84 Statistics Summary – Formulas. RVCC rme Page 1. S x i n. x =. Where: S means sum (add) x is the sample mean x i is each of the observed values n is the sample size (number of observations). Where: S means sum (add) x is the sample mean

E N D
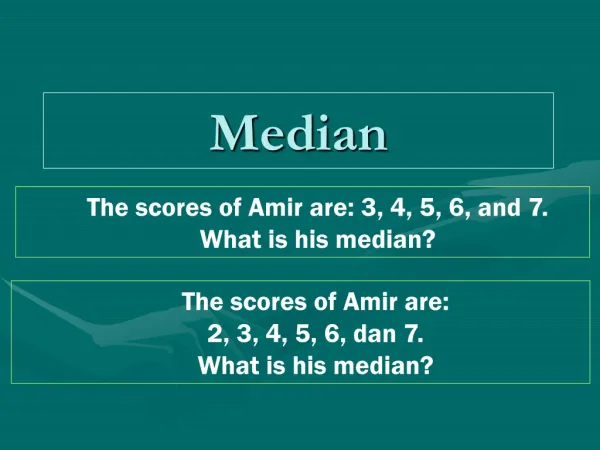
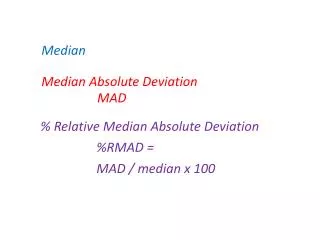
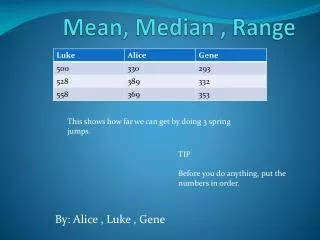
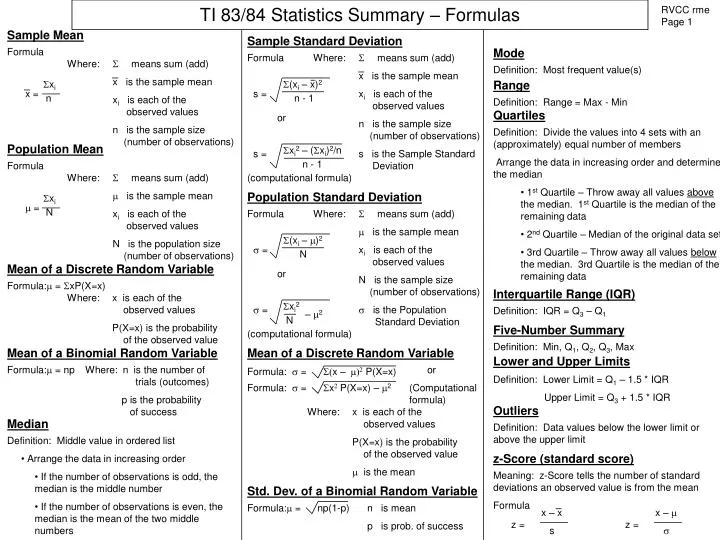
TI 83/84 Statistics Summary – Formulas RVCC rme Page 1 Sxi n x = Where: S means sum (add) x is the sample mean xi is each of the observed values n is the sample size (number of observations) Where: S means sum (add) x is the sample mean xi is each of the observed values n is the sample size (number of observations) s is the Sample Standard Deviation Median • Definition: Middle value in ordered list • Arrange the data in increasing order • If the number of observations is odd, the median is the middle number • If the number of observations is even, the median is the mean of the two middle numbers Population Mean Formula Where: S means sum (add) m is the sample mean xi is each of the observed values N is the population size (number of observations) Sxi N m = Interquartile Range (IQR) Definition: IQR = Q3 – Q1 x – m s x – x s Mode Five-Number Summary z = z = s = Sxi2 N – m2 Definition: Most frequent value(s) Definition: Min, Q1, Q2, Q3, Max Sample Standard Deviation Lower and Upper Limits S(xi – x)2 n - 1 Quartiles Formula Definition: Lower Limit = Q1 – 1.5 * IQR Upper Limit = Q3 + 1.5 * IQR Definition: Divide the values into 4 sets with an (approximately) equal number of members s = Outliers • Arrange the data in increasing order and determine the median • 1st Quartile – Throw away all values above the median. 1st Quartile is the median of the remaining data • 2nd Quartile – Median of the original data set • 3rd Quartile – Throw away all values below the median. 3rd Quartile is the median of the remaining data Sxi2 – (Sxi)2/n n - 1 Definition: Data values below the lower limit or above the upper limit or z-Score (standard score) s = Meaning: z-Score tells the number of standard deviations an observed value is from the mean (computational formula) Formula Range Formula:m = np(1-p) Definition: Range = Max - Min Sample Mean Formula Population Standard Deviation Formula Where: S means sum (add) m is the sample mean xi is each of the observed values N is the sample size (number of observations) s is the Population Standard Deviation S(xi – m)2 N s = Mean of a Discrete Random Variable or Formula:m = SxP(X=x) Where: x is each of the observed values P(X=x) is the probability of the observed value (computational formula) Mean of a Binomial Random Variable Mean of a Discrete Random Variable Formula: s = S(x –m)2P(X=x) Formula:m = np Where: n is the number of trials (outcomes) p is the probability of success or Formula: s = Sx2P(X=x) – m2 (Computational formula) Where: x is each of the observed values P(X=x) is the probability of the observed value m is the mean Std. Dev. of a Binomial Random Variable n is mean p is prob. of success
TI 83/84 Statistics Summary – Formulas RVCC rme Page 2 P(X = x) = ( ) px (1-p)n-x nx ( ) = n n! x x!(n-x)! x – m s/ n t = Factorial Studentized Version of Sample Means (t-Score) k! = k. (k-1). (k-2)…. 3. 2. 1 Binomial Coefficient Where: x is the sample mean m is the population mean s is the sample standard deviation n is the sample size df (degrees of freedom) = n - 1 Where: x is the number of successes (between 0 & n) n is the number of trials (n – x) is the number of failures Binomial Probability Formula Where: P(X=x) is the probability of x successes x is the number of successes (between 0 & n) n is the number of trials (n – x) is the number of failures p is the probability of success of a single trial (1 – p) is the probability of failure of a single trial