Download
1 / 42
420 likes | 742 Views
Outline. Description of ExampleDescriptive SummariesInvestigation of Various ModelsConclusions. Study of CS students . Computer science majors at Purdue have a large drop out rateCan we find predictors of successPredictors must be available at time of entry into program . Data available. GPA after three semesters High school math gradesHigh school science gradesHigh school English gradesSAT MathSAT VerbalGender (of interest for other reasons).

E N D
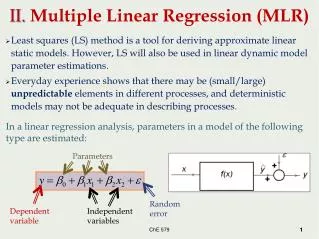
1. Topic 13: Multiple Linear Regression Example
3. Study of CS students Computer science majors at Purdue have a large drop out rate
Can we find predictors of success
Predictors must be available at time of entry into program
4. Data available GPA after three semesters
High school math grades
High school science grades
High school English grades
SAT Math
SAT Verbal
Gender (of interest for other reasons)
5. Data for CS Example Y is grade point average
3 HS grades and 2 SATs are the explanatory variables (p=6)
Have n=224 students
6. Descriptive Statistics
7. Output from Proc Means
8. Output from Proc Means
9. Descriptive Statistics
11. High School Math
12. High School Science
13. High School English
14. SAT Math
15. SAT Verbal
16. Interactive Data Analysis Click on menu
Solutions -> analysis -> interactive data analysis
Obtain SAS/Insight window
Open library work
Click on Data Set A1 (if it exists)
Open
17. Scatter Plot Matrix (shift) Click on GPA, SATM, SATV
Go to menu Analyze
Choose option Scatterplot(XY)
Try some other options
18. Scatter Plot Matrix
19. Correlations
20. Output from Proc Corr
21. Output from Proc Corr
22. Output from Proc Corr
23. Use High School Grades to predict GPA
25. CS ANOVA Table
26. Remove HSS
28. Rerun with HSM only
30. SATs
32. HS and SATs
36. Best Model?
37. Key ideas from case study First, look at graphical and numerical summaries for one variable at a time
Then, look at relationships between pairs of variables with graphical and numerical summaries.
Use plots and correlations
38. Key ideas from case study The relationship between a response variable and an explanatory variable depends on what other explanatory variables are in the model
A variable can be a significant (P<.05) predictor alone and not significant (P>0.5) when other X�s are in the model
39. Key ideas from case study Regression coefficients, standard errors and the results of significance tests depend on what other explanatory variables are in the model
40. Key ideas from case study Significance tests (P values) do not tell the whole story
Squared multiple correlations give the proportion of variation in the response variable explained by the explanatory variables) can give a different view
We often express R2 as a percent
41. Key ideas from case study You can fully understand the theory in terms of Y = X� + ?
To effectively use this methodology in practice you need to understand how the data were collected, the nature of the variables, and how they relate to each other
42. Background Reading