Download

1 / 48
480 likes | 692 Views
Data File Structure and Content. Joe Larson 5 / 6 / 09. Outline. What’s in a Data Set? - File Setup - Key Variables Data Conventions Fun With Demographics. What’s in a Data Set?. File Setup. Data on the web is broken up into the forms it was collected on.

E N D
Data File Structure and Content Joe Larson 5 / 6 / 09
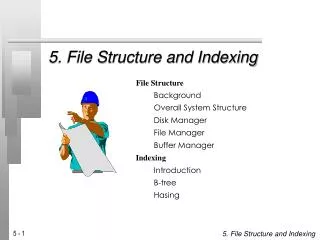
Outline • What’s in a Data Set? - File Setup - Key Variables • Data Conventions • Fun With Demographics
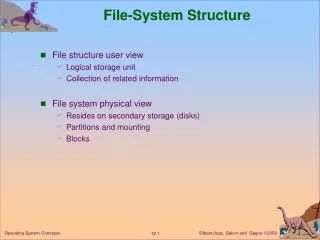
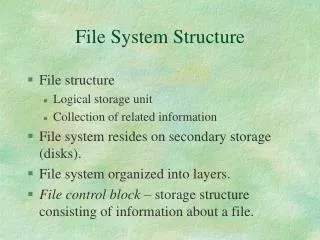
File Setup • Data on the web is broken up into the forms it was collected on. • Different forms can have different collection time(s) and different participant subgroups
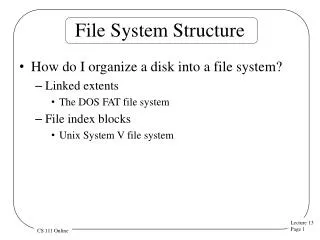
Available Data is Broken up by Form • All data on the web is arranged by form Exceptions: - Outcomes file - Demographics file • Variables within a data set are in the order of the questionnaire, with any computed variables at the end of the file
Different Forms…Different Participants…Different Times • Forms collected only once result in a file with one record per person • Forms collected numerous times throughout follow-up result in a file with multiple records per person • Some data is only available for specific groups of participants (i.e. DM Only, blood subsample, etc.) • Specifics for an individual file can be found in its corresponding data dictionary
Key Variables • Some variables are found in every file (with the exceptions of the demographics and outcomes files) - ID - Days since randomization/enrollment - Visit type / Visit number - Form closest to visit - Expected for visit
Key Variables • Let’s take a look at actual Form 80 File
Participant ID (ID) • The ID variable is common to all of the web files. • Completely independent of the member ID that is used at the individual clinics. • Also independent of the Public and blood draw IDs.
Days Since Randomization / Enrollment (F80DAYS) • We do not give out actual dates for forms or events. • Time is calculated between randomization (CT) or enrollment (OS) and the form date.
Visit Type (F80VTYP) & Visit Number (F80VNUM) • These variables combine to let you know when data was collected. • For example, in the second line of the data on the previous slide we can see that the record is for “Annual Visit 3”. This matches up well with the 1189 days since randomization
Closest to Visit Within Visit Type and Number (F80VCLO) • On rare occasions multiple forms were filled out or entered for the same participant at the same follow-up visit • This variable identifies the visit closest to the actual date. For example, a year 1 annual visit with a value of “Yes” for VCLO will be the year 1 visit that is closest to 365 days from randomization/enrollment
Expected for Visit (F80EXPC) • Sometimes forms are filled out by participants who should not be filling them out • The expected for visit flag identifies data that were expected by protocol
File Setup / Key Variables • Files are arranged by form on the web at www.whiops.org • File structure and participant group varies by form and is in the data dictionary • ID, Visit Type, and other important variables can be found at the start of each file
Data Conventions • Skip patterns • Mark all that apply • Version differences
Skip Patterns • Questions within a form are often set up with a hierarchical structure with parent questions and subquestions • In most cases, the sub-questions are set to missing if the parent value indicates the sub-questions should not be answered. This is the application of a skip pattern • In a few cases where the error percentage is high, the skip pattern is not applied
Example: Skip Pattern Applied Error Percentage < 1% Skip pattern QA applied Sub-questions
Example: Skip Pattern Not Applied Error Percentage ~ 6-12%
If the Skip Pattern is not Applied • It will be in the data dictionary
Mark All That Apply • One question with multiple choices is • converted to separate indicator variables • of 0’s and 1’s What kind of pet do you have? (mark all that apply) Dog(s) Cat(s) Bird(s) Fish Other 1 2 3 4 5 0 0 1 1 1
Version Issues • Sometimes questions are not asked on all versions of a form, leading to higher percentages of missing data • The Data Dictionary will have this
Data Conventions • Some cleaning was done to the data before it reached the web • Skip patterns and mark-all-that-apply conversions were usually done • Sometimes questions were not collected on all versions of a form • In all cases, any issues are documented in the data dictionary
The Demographics File • The demographics file is the glue that pulls most analyses together • It contains important variables that are used in just about every analysis • The file has one record per person
Trial Participation Flags • Trial Flags distinguish what part of the WHI a participant is in • In addition to CT and OS indicators, there are indicator variables for each clinical trial component
Basic Demographic Data • Including age, ethnicity, education, and income can be found here • Because clinical center data has not been released, the “U.S. Region” variable is the best variable to use for geographic location
Trial Arms • These are the key variables for any analysis on the clinical trial. • The hormone arm variable can also be used to separate out participants in the two hormone trials
Days from CT to CaD Randomization • Key variable used to determine how far a follow-up visit is from CaD randomization • To determine days from CaD randomization - Start with the days from CT randomization - Subtract the days from CT to CaD randomization
BMD Subsample Indicator • A ‘yes’ response indicates that the participant was at one of the three BMD clinics
Fun With Demographics • The demographics file is a key file used in most analyses • It includes trial participation and treatment status variables, as well as basic demographic data
Stay Tuned • Later I’ll be doing a beginning to end example: - Going to the web - Hunting down variables - Downloading the data - Loading it into SAS - Merging files together - Running some basic frequencies • And taking questions while I do it!