Download
1 / 6
60 likes | 207 Views
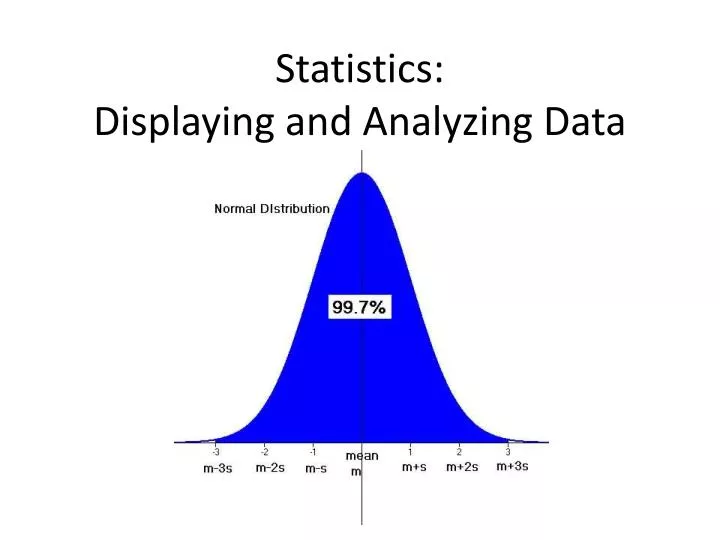
Statistics: Displaying and Analyzing Data. Line Plot. Line Plot Frequency: the number of times something occurs. Use an “x” to show the number of times each data item occurs. Make a Line Plot of the following data set. {11, -2, 10, -2, 7, 2, 7, 4, 9, 0, 6, 9, 7, 2, 0, 4, 10, 7, 6, 9}.

E N D
Line Plot • Line Plot • Frequency: the number of times something occurs. Use an “x” to show the number of times each data item occurs. • Make a Line Plot of the following data set. {11, -2, 10, -2, 7, 2, 7, 4, 9, 0, 6, 9, 7, 2, 0, 4, 10, 7, 6, 9}
Stem and Leaf Plot • Organizes data visually in a ordered list to see what information is in the list. • The Leaf is the digit in the one’s place and the Stem is the remaining digits of the number.
Stem and Leaf Continued… • Make a Stem and Leaf Plot of the following data set. {85, 115, 126, 92, 104, 107, 78, 131, 114, 92, 85, 116, 100, 121, 123, 131, 88, 97, 99, 116, 79, 90, 110, 129, 108, 93, 84, 75, 70, 132} Find the smallest and the largest number. Make your Stems in order down the left side from smallest to largest number. Then write the digit for each corresponding number in its appropriate row. Count the numbers in the list and make sure you have the same number of entries in your plot. Reorganize the plot in the correct order for the leaves. Stem Leaf Stem Leaf
Back-to-Back Stem and Leaf Plot • Use a Back-to-Back Stem and Leaf Plot when you have two sets of data for the same problem. Group 2 Group 1
Uses for Line and Stem and Leaf Plots • You can find Averages: Median, Mode, Mean which are measures of central tendency. • Median and mode are easier to find and the Mean has to be calculated. • Median: • Mode: • Mean: