Download
1 / 21
210 likes | 318 Views
Trends in Sediment Delivery from Bay Area Watersheds determined from sediment budget analysis. Peter W. Downs Stillwater Sciences, Berkeley, CA. Lagunitas Creek – sediment budget since 1983. Total area = 281.4 km 2. = 93.3 km 2. = 19.1 km 2. = 64.3 km 2. Periods

E N D
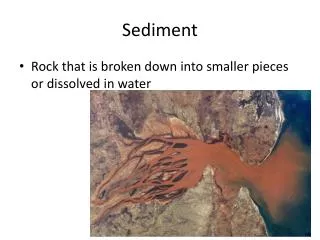
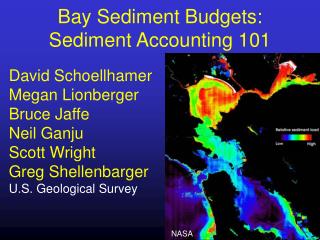
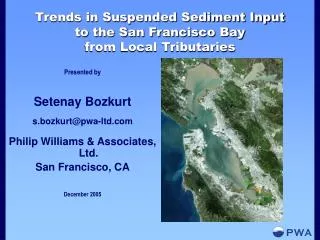
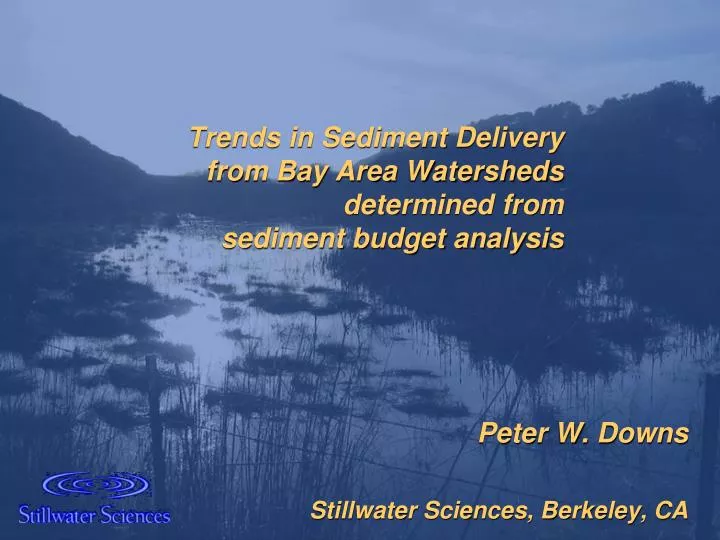
Trends in Sediment Delivery from Bay Area Watersheds determined from sediment budget analysis Peter W. Downs Stillwater Sciences, Berkeley, CA
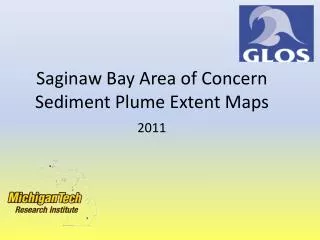
Lagunitas Creek – sediment budget since 1983 Total area = 281.4 km2 = 93.3 km2 = 19.1 km2 = 64.3 km2 Periods 1850-1918: European arrival & resource development 1919-1945: regulation and grazing 1946-1982: intensive damming 1983-present: raising of Peters Dam, planning, mitigation = 49.0 km2 = 55.7 km2
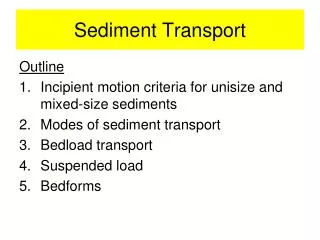
Approach • Data sources • Establishing rates • existing quantitative sediment source inventories • analysis of sequential aerial photographs • hillslope and in-channel reconnaissance • digital terrain modeling of GLUs for extrapolation • soil production / diffusion model application • road sediment model application • Corroborating rates • literature review of nearby process rates estimates • analysis of gauging records for sediment yields • bathymetric surveys of Nicasio Reservoir • Management scenarios • sediment transport modeling
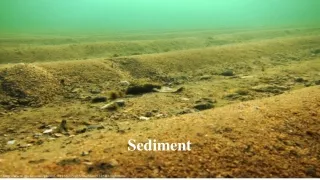
Discrete hillslope sources From air photo analysis From field surveys
Channel-related erosion Channel incision Bank erosion
Corroboration 1:Gauged sediment yields San Geronimo Lagunitas @ SPT Lagunitas @ PRS
Corroboration 2:Bathymetric yields Section 12B-12A Section 6A-6B
SedimentBudget – sub-watershed Sediment Yields t a-1 M = mainstem T = tributary & hillslope
Sediment Yields t a-1 SedimentBudget – processes 26% 42% 20%
Implications for the SF Bay…or “So What?” Lagunitas Creek (62.4 km2) • 1983-2008 ~ 330 t km-2 a-1 • (Gauges = 131 – 276; bathymetry = 350 – 464; GLUs = 285 – 383) Southern Tomales bay sedimentation (226-132 km2): Rooney & Smith (1999) • 1861-1931: 325 t km-2 a-1 (prograded primarily 1862-1918) • 1931-1957: 290 t km-2 a-1 • 1957-1994: 190 t km-2 a-1 (dry period; not efficient trapping) Redwood Creek (22.7 km2) • Pre 1840: 34 t km-2 a-1 • 1841-1920: 304 t km-2 a-1 – Euro Arrival and Resource Development: • 1921-1980: 324 t km-2 a-1 – Engineering as Management: • 1981-2002: 198 t km-2 a-1 – Recovery & Restoration – reduces with incision • Future: 154 t km-2 a-1 – because of legacy destabilization of tributaries
Redwood Creek Pre- 1840 1841 - 1920 1921 - 1980 1981 - 2002
Estuarine Deposits Jon Warrick’s slides
Thoughts…Sac/SJR vs. SF Bay Area Tribs? • Pre-European – less “well-connected”: effective area smaller, overbank storage; • ~30 t km-2 a-1 ? • Post-arrival, “resource development”, channel management, first flush: • > 350 t km-2 a-1; 500 t km-2 a-1 over decades? • Now, “normal” developed use = > 300 t km-2 a-1 • Much from channels • Under “protective custody” = < 200 t km-2 a-1 in high relief watershed • Incision (loss of alluvial storage) is a very effective delivery mechanism • 100% delivery; very little overbank storage • Not just volumes: changing sediment sources, and sediment caliber
Conceptual Model Yields proportional to: • Relief • Relative erodibility (geology) • Frequency of large floods / high intensity precipitation events – ENSO • Fire / earthquakes triggering landslides • Effective contributing area – tributary disconnection • (Availability of marsh / lagoon / estuary habitat ) • Land use history: agriculture vs. conservation management • Road and rail • Channel management impacts on disconnecting floodplains: straightening (drainage or flood control) • Dams: existing and former – supply reduction them increase • Urban development – supply increase then reduction then increase… • Aggregated mining – interception possibly, more likely narrowing and baseline related incision • 1 / Area