Download
1 / 35
350 likes | 494 Views
Where There’s Smoke There’s Fire: What’s Behind the Curtain. Kathy Conway Co-facilitator: Southern Oregon Climate Action Now http://socan.info k athleendconway@gmail.com 541 – 324 – 4501. Outline. Just a bad fire year? Local projections Temperature Green House Gas Basics Take Action

E N D
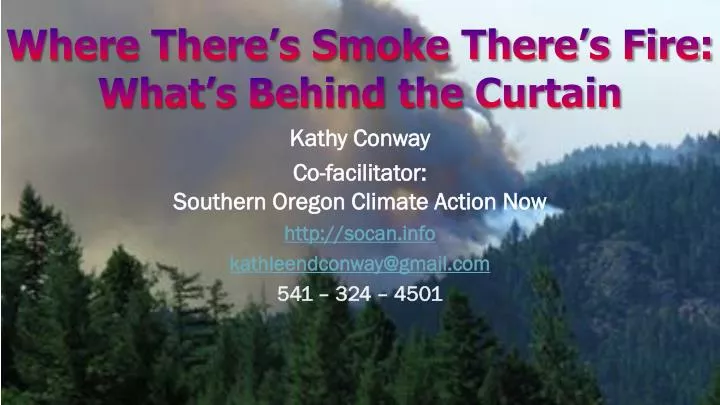
Where There’s Smoke There’s Fire:What’s Behind the Curtain Kathy Conway Co-facilitator:Southern Oregon Climate Action Now http://socan.info kathleendconway@gmail.com 541 – 324 – 4501
Outline • Just a bad fire year? • Local projections • Temperature • Green House Gas Basics • Take Action • SOCAN
Outline • Just a bad fire year? • Local projections • Temperature • Green House Gas Basics • Take Action • SOCAN
Western Wildfires & Climate Change http://www.ucsusa.org/global_warming/science_and_impacts/impacts/infographic-wildfires-climate-change.html
Western Wildfires & Climate Change http://www.ucsusa.org/global_warming/science_and_impacts/impacts/infographic-wildfires-climate-change.html
Western Wildfires & Climate Change http://www.ucsusa.org/global_warming/science_and_impacts/impacts/infographic-wildfires-climate-change.html
Wildfires 10 F makes difference between a high fire year and a low fire year.(http://news.discovery.com/earth/climate-change-yellowstone-fires.html )
Outline • Just a bad fire year? • Local projections • Temperature • Green House Gas Basics • Take Action • SOCAN
1961-1990 Ave – 50.030F Summer Ave – 63.580F Winter Ave – 38.170F 1961-1990 Ave – 50.030F Summer Ave – 63.580F Winter Ave – 38.100F 1900 2000 2099 Rogue Valley Temperature History and Projections
Projected Temperature Increases 2035-2045 Average1.6 – 4⁰F(51.6 – 53.8⁰F) Winter 1 – 3.5⁰F(39.1 – 41.7⁰F) Summer1 – 6⁰F(64.4 – 69.5⁰F) August 1 – 7.5⁰F(67.1 – 73.5⁰F) 2075-2085 Average4.3 – 8.2⁰F(54.3 – 58.2⁰F) Winter 3.4 – 6.3⁰F(41.5 – 44.5⁰F) Summer5.5 – 11.8⁰F(69.1 – 75.4⁰F) August6.7 – 16.8⁰F(72.7 – 82.8⁰F)
Historic Precipitation National increaseof 5% Global Climate Change Impacts in the U.S.
Projected PrecipitationSeasonal Pattern –HighEmissions Scenarios
Declining Mid-Elevation Snowfall 7,000 – 8,000 ft N. California 1950 - 2000 Below 7500’ 13% decline Above 7500’ 12% increase Applegate Lake 25% Reduction By the end of the century, there may be 90% reduction. Source: Crater Lake National Park
Outline • Just a bad fire year? • Local projections • Temperature • Green House Gas Basics • Take Action • SOCAN
Global Temperatures 1880 – 2012cf 1951-1980 Since 1970s + 1.3⁰F Since 1880s + app. 1.65⁰F 2010 2012 2009 2011 2008 2000-2009 was hottestdecade on record Nine of the ten hottest years recordedoccurred in that decade The 15 hottest year recordedare post 1997 http://data.giss.nasa.gov/gistemp/graphs_v3/Fig.A.gif
Future Temperature Range There is much variability – depends on what we do. http://epa.gov/climatechange/science/futuretc.html
Outline • Just a bad fire year? • Local projections • Temperature • Green House Gas Basics • Take Action • SOCAN
The Atmospheric “GreenhouseEffect" Transformed toInfra-red radiation= heat – re-radiated out Remainder escapesinto space Some infra-red radiation is absorbed by atmospheric gases (CO2, methane, oxides of nitrogen) Incoming Visible light WARNING: Not drawn to scale
NOTE: Absorbency is in lower atmosphere – which is where we live
Less escapesinto space If atmospheric gas density increases, more heat is retained by this ‘thermalblanket’ Warming Surface - LowerAtmosphere
Finally – Definitive, Irrefutable, Confirmation of Global Warming…
Outline • Just a bad fire year? • Local projections • Temperature • Green House Gas Basics • Take Action • SOCAN
The Problem 2000 Global Emissions • Greenhouse gases released by human activity: • Carbon dioxide • Methane • Oxides of nitrogen B UT Approximately 75% > 75% 23 X CO2 296 X CO2 http://en.wikipedia.org/wiki/Greenhouse_gas
2006 U.S. GHG Emissions: sectors view U.S. Total GHG Emissions (2006) = 7.1 billion MT CO2e Source: EPA’s Opportunities to Reduce Greenhouse Gas Emissions through Materials and Land Management Practices
What produces carbon emissions locally? Good Co, Eugene, OR GHG Inventory http://rvcog.org/cogboard/2011/Dec_14/RVCOG-REA-Final_PPT-121511.pdf
Outline • Just a bad fire year? • Local projections • Temperature • Green House Gas Basics • Take Action • SOCAN
http://socan.info Co-Facilitators: Alan Journet alanjournet@gmail.com Kathy Conway kathleendconway@gmail.com MEETINGS: Last Tuesday of the month (except September 17th) Special Topic Presentation 6:00 – 6:30 pm General Meeting: 6:30 – 8:00 pm Medford Pubic Library, 205 S. Central Ave.
Mission & Goal Statement The Mission of SOCAN is: • To recognize the urgency for bold action against climate change • To promote awareness and understanding about the causes and consequences of climate change • To develop solutions and motivate concerned citizens to take action Our Goal: Collaborating with individuals and organizations throughout the world, we seek a reduction in the global atmospheric carbon dioxide concentration to 350 parts per million. To achieve this, we encourage both personal and governmental actions that reduce carbon dioxide emissions from individual to global levels.
Focus Groups • Community • Education • Green Energy • Natural Resources • Government
Projects • Divestment from Fossil Fuels • Climate change in the curriculum • Weather Reporting • Presentations • Federal, State & Local Governments • Networking • Bear Creek Salmon Festival Booth (October 5, 2013)
Where There’s Smoke There’s Fire:What’s Behind the Curtain What will you do to protect future generations? http://socan.info
Want to Learn More? 'Climate Change and the Rogue Valley;' a ten week SOU/OLLI course; will be presented Thursdays 1:00 - 3:00 pm from September 12th at the SOU/RCC HEC in Medford - contact SOU/OLLI. (541) 552-6048 'A Rogue Climate for the Valley;' a three week Ashland North Mountain Park Nature Center course; Tuesdays 7:00 - 9:00 pm from October 1st - contact the Nature Center. (541) 488-6606 'A Rogue Climate for Our Valley;' three week Coyote Trails Jefferson Nature Center Course; Saturdays 1:00 - 3:00 pm from November 9th - contact Coyote Trails: 541-772-1390