Download
1 / 16
210 likes | 435 Views
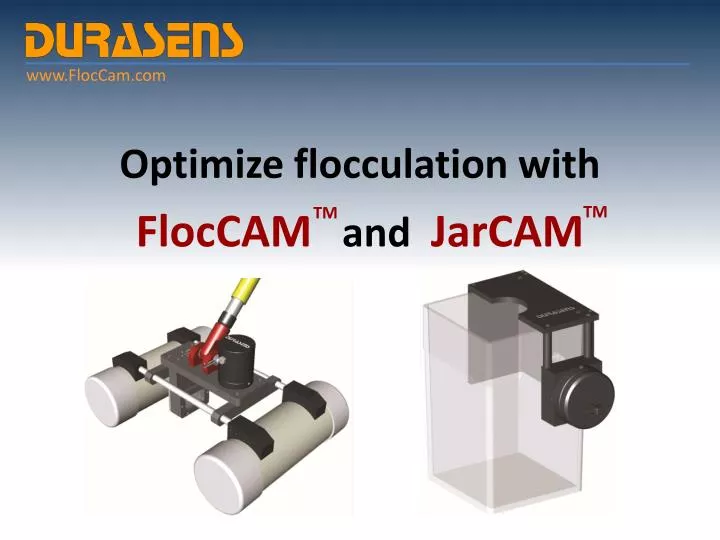
www.FlocCam.com. Optimize flocculation with FlocCAM and JarCAM. TM. TM. Coagulation & Flocculation. www.FlocCam.com. Coagulation add a coagulant that makes the suspended particles “ sticky ”. Coagulation & Flocculation. www.FlocCam.com. Flocculation

E N D
www.FlocCam.com Optimize flocculation withFlocCAM and JarCAM TM TM
Coagulation & Flocculation www.FlocCam.com • Coagulation • add a coagulant that makes the suspended particles “sticky”
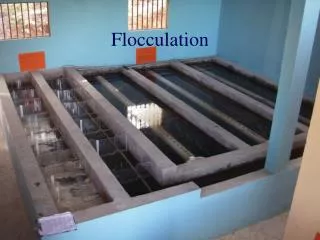
Coagulation & Flocculation www.FlocCam.com • Flocculation • Gentle stirring increases particle collisions • Particles stick together, form settleable or filterable floc
Ten State Standards www.FlocCam.com • Coagulation • Mixing: ≤ 30 seconds • Velocity gradient: G ≥ 750 fps/ft http://10statesstandards.com/waterrev2012.pdf
Ten State Standards www.FlocCam.com • Flocculation • Residence time: ≥ 30 mins • Flow-through velocity: 0.5 to 1.5 ft/min • Agitator paddle peripheral speed: 0.5 to 3.0 ft/sec http://10statesstandards.com/waterrev2012.pdf Very large ranges within guidelines for operation... What are our goals?
Goals of Coagulation & Flocculation www.FlocCam.com • To “change the particle size distribution to best suit the subsequent processes.”(Han et al., 1999) • To reach “the conditions of dosage and pH that achieve a minimum particle count and turbidity, maximum TOC, DOC and DBP removal and minimum coagulant residual.”(Edzwald & Tobiason, 1999) • To “transform suspended colloidal particles into flocs that can be removed by sedimentation.”(Tse et al., 2011)
How do we know if we’re achieving these goals? www.FlocCam.com • Conventionally, treatment plants monitor: • Zeta Potential (streaming current monitor) • Although it can give indication of proper coagulant addition, does not give information regarding physical properties of flocs and size distribution • Settled water turbidity • Measurement taken towards end of treatment; by the time operator sees a problem, the problem has likely persisted for hours • TOC, DOC and DBP removal • Typically not used as direct indications that proper flocculation is taking place
www.FlocCam.com How do we know if we’re achieving these goals? • Experienced operators often look in a flocculation basin to confirm that the process is healthy • What are they trying to see? • Average particle size • Particle size distribution • Average particle density • Average particle velocity The FlocCAM and JarCAM are tools that quantify flocs’ physical properties TM TM
The FlocCAM www.FlocCam.com TM • The FlocCAM is designed to be mounted atop the flocculation basin and provide the operators detailed information in real-time: • Average particle size • Size skew, indicating particle size distribution • Average particle density • Average particle velocity • Average particle sphericity • Average particle mass TM
FlocCAM Computer Interface www.FlocCam.com TM Graph displaying two parameters over time Live video from the floc basin All data updated in real-time Data is then stored in an easily-accessible file for future reference
FlocCAM Benefits www.FlocCam.com TM • Quantifies data in real-time regarding flocs’ physical properties • Video feed facilitates flocculation monitoring • Data often functions as the first quantitative assessment that the plant is operating correctly • Enables operators to evaluate the effects of miniscule chemical dose changes on flocculation performance, leading to chemical cost savings • Allows operators to predict and monitor the number of flocs being transferred through to the filters, therefore lengthening filter run times • Stored data allows operators to compare past and current flocculation performance • Facilitates communication between operators regarding plant performance
Ten State Standards www.FlocCam.com • “The operator and design engineer should determine the appropriate G value and detention time through jar testing.” http://10statesstandards.com/waterrev2012.pdf
The JarCAM www.FlocCam.com TM • The JarCAM is designed to be mounted on the side of a jar during a jar test. During the jar test, it provides the same data as the FlocCAM : • Average particle size • Size skew, indicating particle size distribution • Average particle density • Average particle velocity • Average particle sphericity • Average particle mass TM TM
JarCAM Computer Interface www.FlocCam.com TM Graph displaying two parameters over time Live video from the floc basin All data updated in real-time After the jar test, data is stored in an easily-accessible file for future reference
JarCAM Benefits www.FlocCam.com TM • Quantifies data in real-time regarding flocs’ physical properties during jar tests • Data provides operators with numerical evidence to use to identify the jar with the optimal chemical dose • Enables operators to differentiate between jars with similar chemical doses • Stored data allows operators to compare current data with previous jar test data • Facilitates communication between operators regarding jar test observations
www.FlocCam.com TM TM Optimize flocculation withFlocCAM and JarCAM Durasens, LLC 141 Tompkins Ave, Pleasantville, NY 10570 T 914 747 7205 F 914 747 7209 Einfo@FlocCAM.com www.FlocCAM.com