Download

1 / 47
470 likes | 608 Views
Wild Steelhead Stock S. t. a. t. u. s. BC 2004. British Columbia in Perspective. 1200 km (720 mi) south to north 500-1000 km (300 – 600 mi) wide 950,000 sq km (367,000 sq mi) 75% mountains; 60% forested; 10% farmland and lakes; <2% rivers 7000 km (4200 mi) of coastline.

E N D
Wild Steelhead Stock S t a t u s . . . BC 2004
British Columbia in Perspective • 1200 km (720 mi) south to north • 500-1000 km (300 – 600 mi) wide • 950,000 sq km (367,000 sq mi) • 75% mountains; 60% forested; 10% farmland and lakes; <2% rivers • 7000 km (4200 mi) of coastline
Population Details • ~4.0Million total • ~ 60% Vancouver • ~16% Vancouver Island • ~24 % elsewhere but only 4% in northern half • <4% Aboriginal
B C (Wild) Steelhead Facts • About 580 steelhead “rivers” (3rd order or larger) • About 630 stocks (85% WSH, 12% ISSH, 3% CSSH) • About 1/3 of rivers along remote mid & N coast (seldom, if ever, fished) • About 1/4 of rivers on Vancouver Island
Number of Streams Stocked with Steelhead Juveniles Originating From Wild Brood Stock (F=fry, S=smolt) Time Island Mainland Thompson Cariboo Skeena All PeriodF SF SF SF SF SFS < 1975 1 3 2 2 0 0 0 0 0 0 3 5 1975–84 11 15 14 8 1 1 2 0 4 1 32 25 1985–94 19 17 18 19 1 1 3 0 8 1 49 38 1995–01 11 10 6 14 1 0 0 0 0 1 18 25 2002 9 9 0? 8 0 0 0 0 0 1 9 18
Steelhead Releases 1975 - 2001 PeriodAv # FryAv # Smolts 1975-79 .07M .07M 1980-84 1.03M .60M 1985-89 1.59M .91M 1990-94 .73M .82M 1995-99 .26M .63M 2000-01 .09M .38M
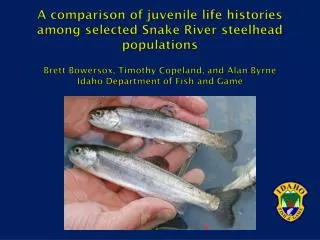
Stock Assessment Methods • Total Counts • Weirs/resistivity counters (Keogh, Deadman, Sustut, Kitwanga) • Indices of Abundance • Gillnet test fisheries (Fraser, Skeena) • Fishwheels (Nass) • Snorkel observations (some total counts) • Aerial Counts (Chilko) • Juvenile sampling
Nass Lake Bell-Irving River Damdochax Creek Bowser Lake Meziadin Lake BC Kwinageese River N White River Nass River Tchitin River 50 km Cranberry River Canyon City (Gitwinksihlkw) Grease Harbour New Aiyansh Kiteen River Kincolith River Kincolith Tseax River Greenville (Lakalzap) Ishkeenickh River Nass River Watershed
Fishwheel Locations Nass River Meziadin Lake Kwinageese River White River N Tchitin River Grease Harbour Cranberry River Canyon City (Gitwinksihlkw) 50 km New Aiyansh Kiteen River Kincolith River Tseax River Kincolith Greenville (Lakalzap) Ishkeenickh River
Nass River Fishwheels • 6 wheels operated annually • Mainly for stock assessment • Late May to late September • Now operated as the sole in-season salmon indicator for the Nass
PrinceRupert BC Digby Kaien Khyex Island Island River Tyee Test Port Edward Skeena River Fishery Chatham Smith Island Sound N Ecstall Porcher River Kennedy Island 0 6 km Island Tyee Test Fishery Location
Khyex River Khyex Bank SKEENA RIVER Highway 16 Lookout Bank Tyee Tyee Test Fishing Site Port Essignton Ecstall River Tyee Test Fishing Site
Moosevale Weir Location Creek Two Lake Creek Johanson Creek Johanson Sustut Lake Lake Birdflat Creek Red Creek Skeena River Asitka River Sustut River Bear River Study Area N Bear Lake Scale: Approximately 1:340,000 Upper Sustut River Watershed
Sustut Weir Counts Estimated K = ~1100
Keogh River Steelhead Smolt counts, 1977 to 2003 • The capacity for smolts dropped from 7,000 (>10,000 with nutrient addition) to <2000 • recent increases in smolts can be attributed to WRP
Smolt-to-adult survival trends SAS has dropped from average of 15% to <4% Like wild coho, SAS increased in ‘97 and ‘98, but recently declined based on returns thus far of 2001 smolts 2001 estimate based on partial returns.
Steelhead smolt yield and adult returns at the Keogh River, B.C.
In Summary: • The “red zone” is not diminishing in size or severity • All the king’s horses and all the king’s men are not putting Humpty together again • Mother nature is a b_ _ _ _! • Fish culture in all it’s forms is not reversing anything • We aren’t fixing the broken habitat and diminished productivity on anywhere near a scale that will make a difference • Those who degraded the habitat are not held accountable • Fisheries managers are becoming as rare as steelhead